3.2. ECG Acquisition & HRV Analysis with BITalino & pyHRV
This tutorial aims to guide you through all the steps from recording your own ECG signals up to computing all HRV parameters using pyHRV and saving them in your own, first HRV report.
The ECG signals will be acquired using a BITalino (r) evolution Board and the OpenSignals (r)evolution software. Additionally, this tutorial uses the BioSPPy toolkit to filter your ECG signal and to extract the R-peak locations. Finally, we’ll use the pyHRV package to compute all available HRV parameters from your ECG signal(s) and generate your first HRV report.
Note
This tutorial demonstrates how to acquire ECG signals using the BITalino toolkit and the OpenSignals software. It is of course not limited to these tools. You can, of course, use any other ECG signal independent from the signal acquisition hardware and software.
Note
The images of OpenSignals, BITalino and electrode placement have been been provided with the friendly support of PLUX wireless biosignals S.A..
3.2.1. Step 1: Getting Started
Acquiring ECG signals requires both hardware and software. With your BITalino device in your hands you have already mastered the first step of this tutorial - hardware: check!
Download & Install OpenSignals (r)evolution
The easiest way to manage your signal acqusitions using BITalino is by using the OpenSignals (r)evolution software. Download and install the OpenSignals (r)evolution software.
Note
OpenSignals (r)evolution uses Google Chrome as rendering engine for its graphical user interface. You must install the Google Chrome Browser before installing OpenSignals.
Before heading directly to the signal acquisition, we’ll install all the Python packages that we’ll be using in this tutorial first.
Download & Install the Packages Used in this Tutorial
OpenSignals (r)evolution can store the raw ECG data in .TXT files which we will be importing into our Python script or project using the opensignalsreader package. You can install this package using the following command in your terminal (macOS and Linux) or command prompt (Windows).
pip install opensignalsreader
Next, we’ll install the BioSPPy toolkit which we’ll use to filter the acquired ECG signals and to extract the R-peak data. You can install this package using the following command in your your command prompt.
pip install biosppy
For the sake of completeness - in case you have not installed it yet - download and install pyHRV package by
using the following command in your terminal or command prompt:
pip install pyhrv
Note
In some cases, pyhrv cannot be installed due to outdated setuptools or (yet) officially supported Python versions. In this case, install the dependencies first before installing pyhrv:
pip install biosppy
pip install matplotlib
pip install numpy
pip install scipy
pip install nolds
pip install spectrum
pip install pyhrv
3.2.2. Step 2: Setting Up the Acquisition
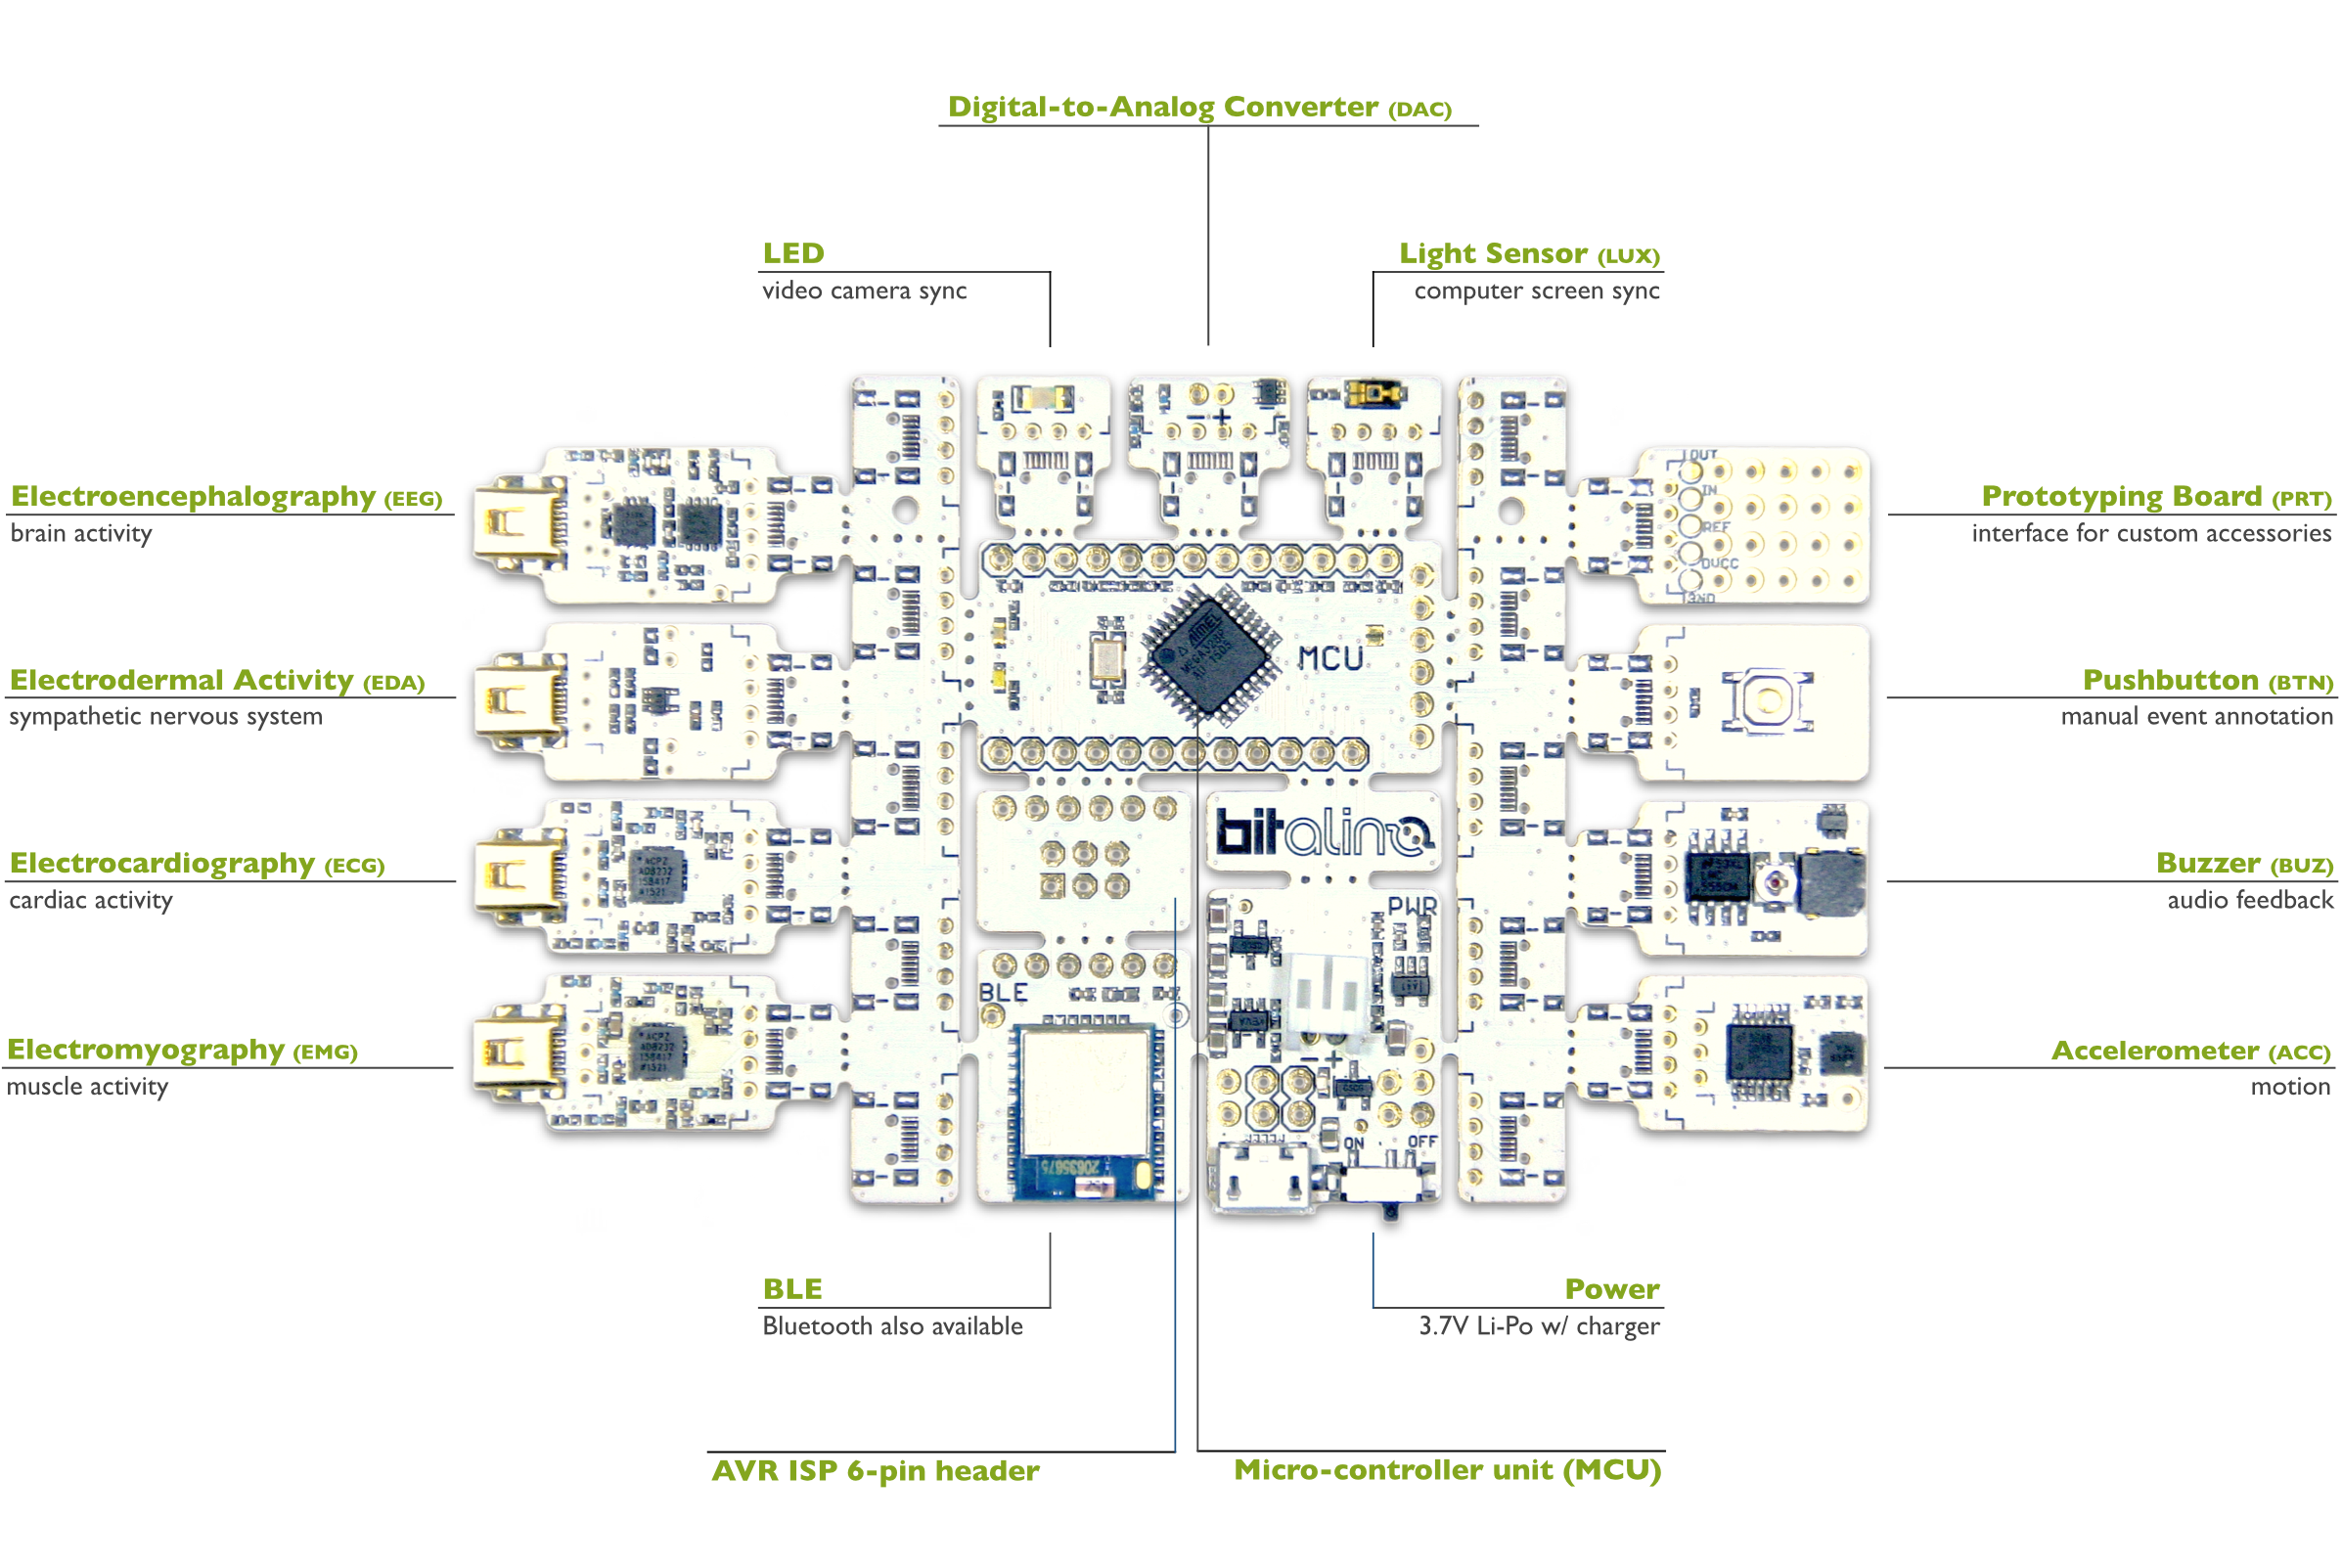
BITalino transmits the acquired sensor signals via Bluetooth to your computer, where the signals can be recorded and visualized in real-time using the OpenSignals software.
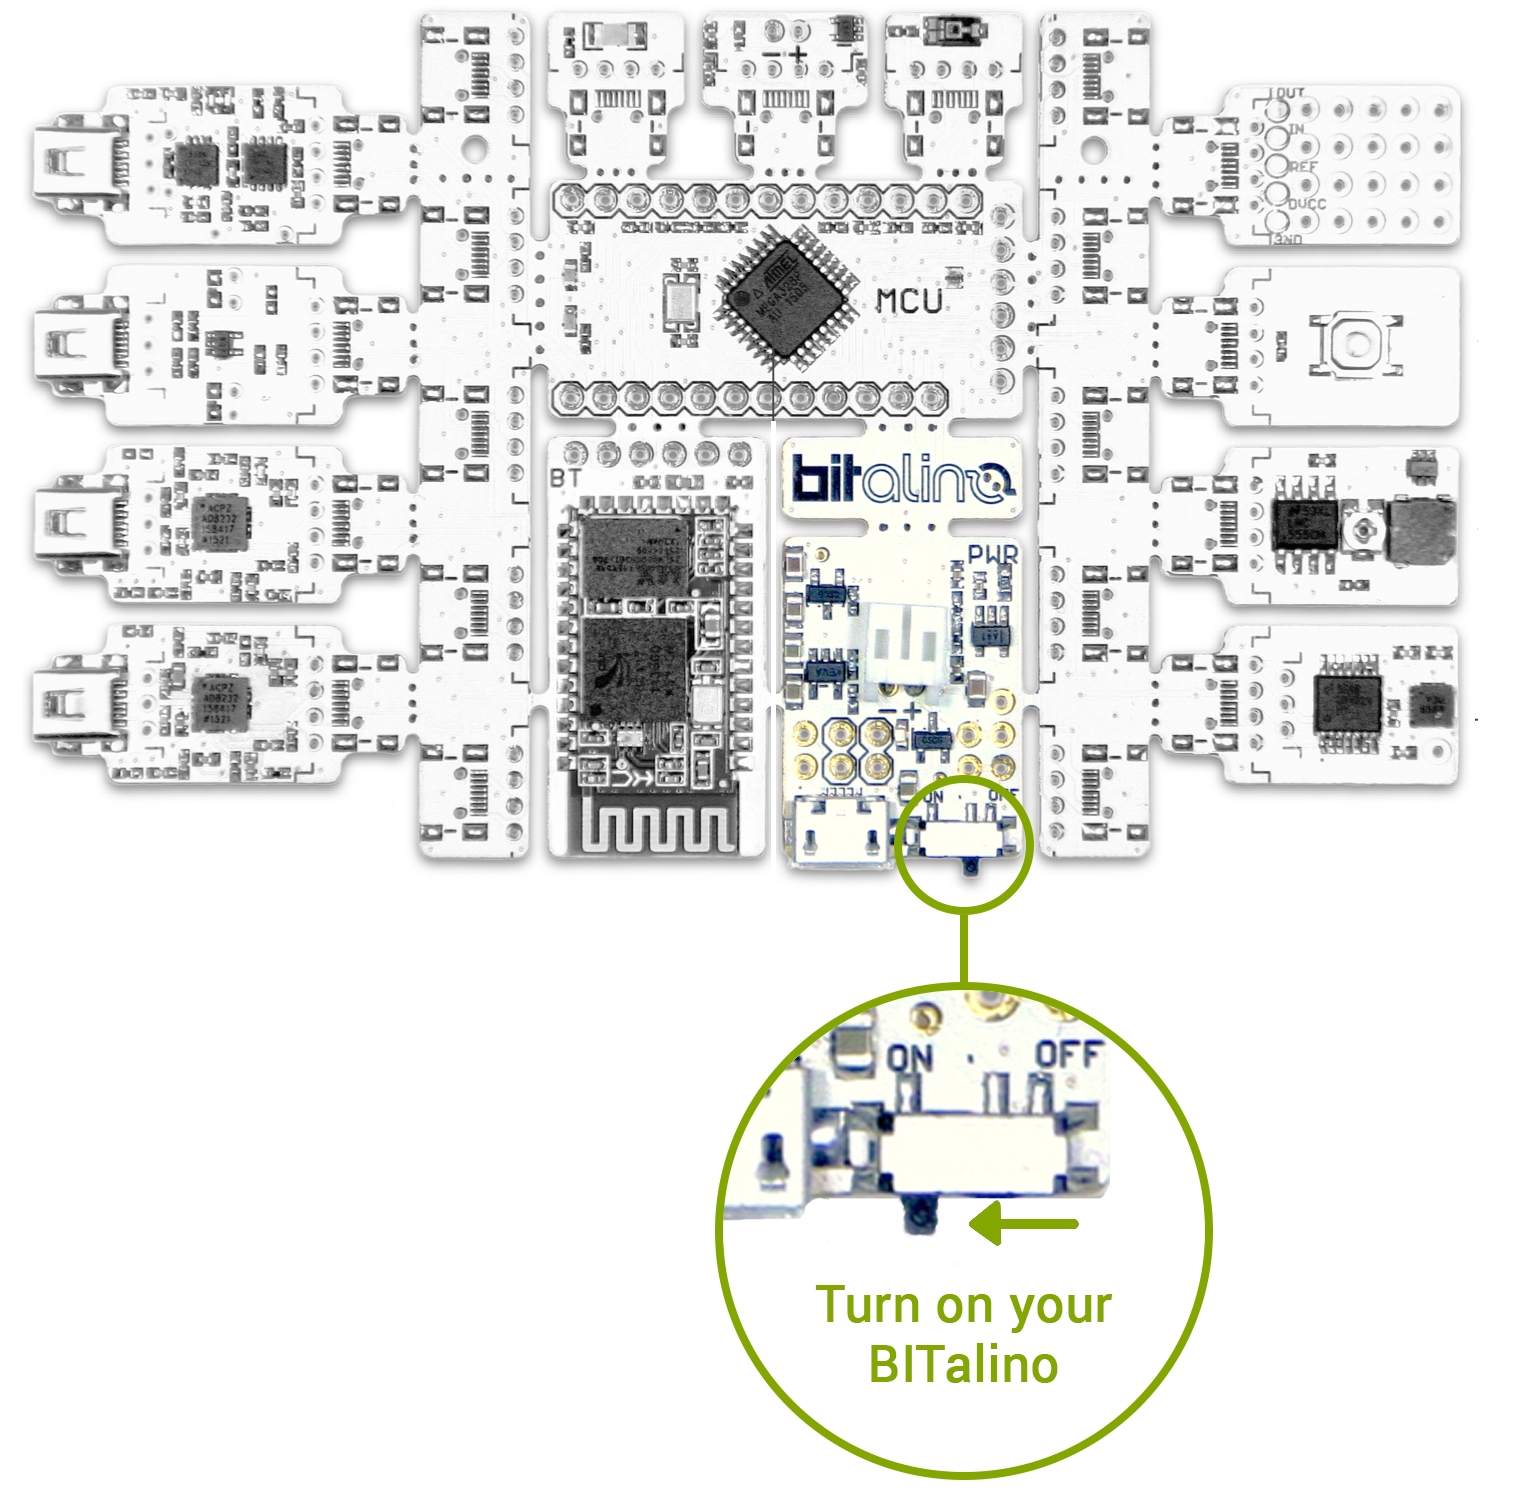
Turn on your BITalino by turning the switch of the power module into the position shown in the image below:
The Bluetooth connection between your BITalino device and your operating system must be established before using the OpenSignals software. Use your operating system’s Bluetooth manager in order to establish the connection.
Note
You will be prompted to insert a pairing code to establish the connection, which for BITalino devices is 1234.
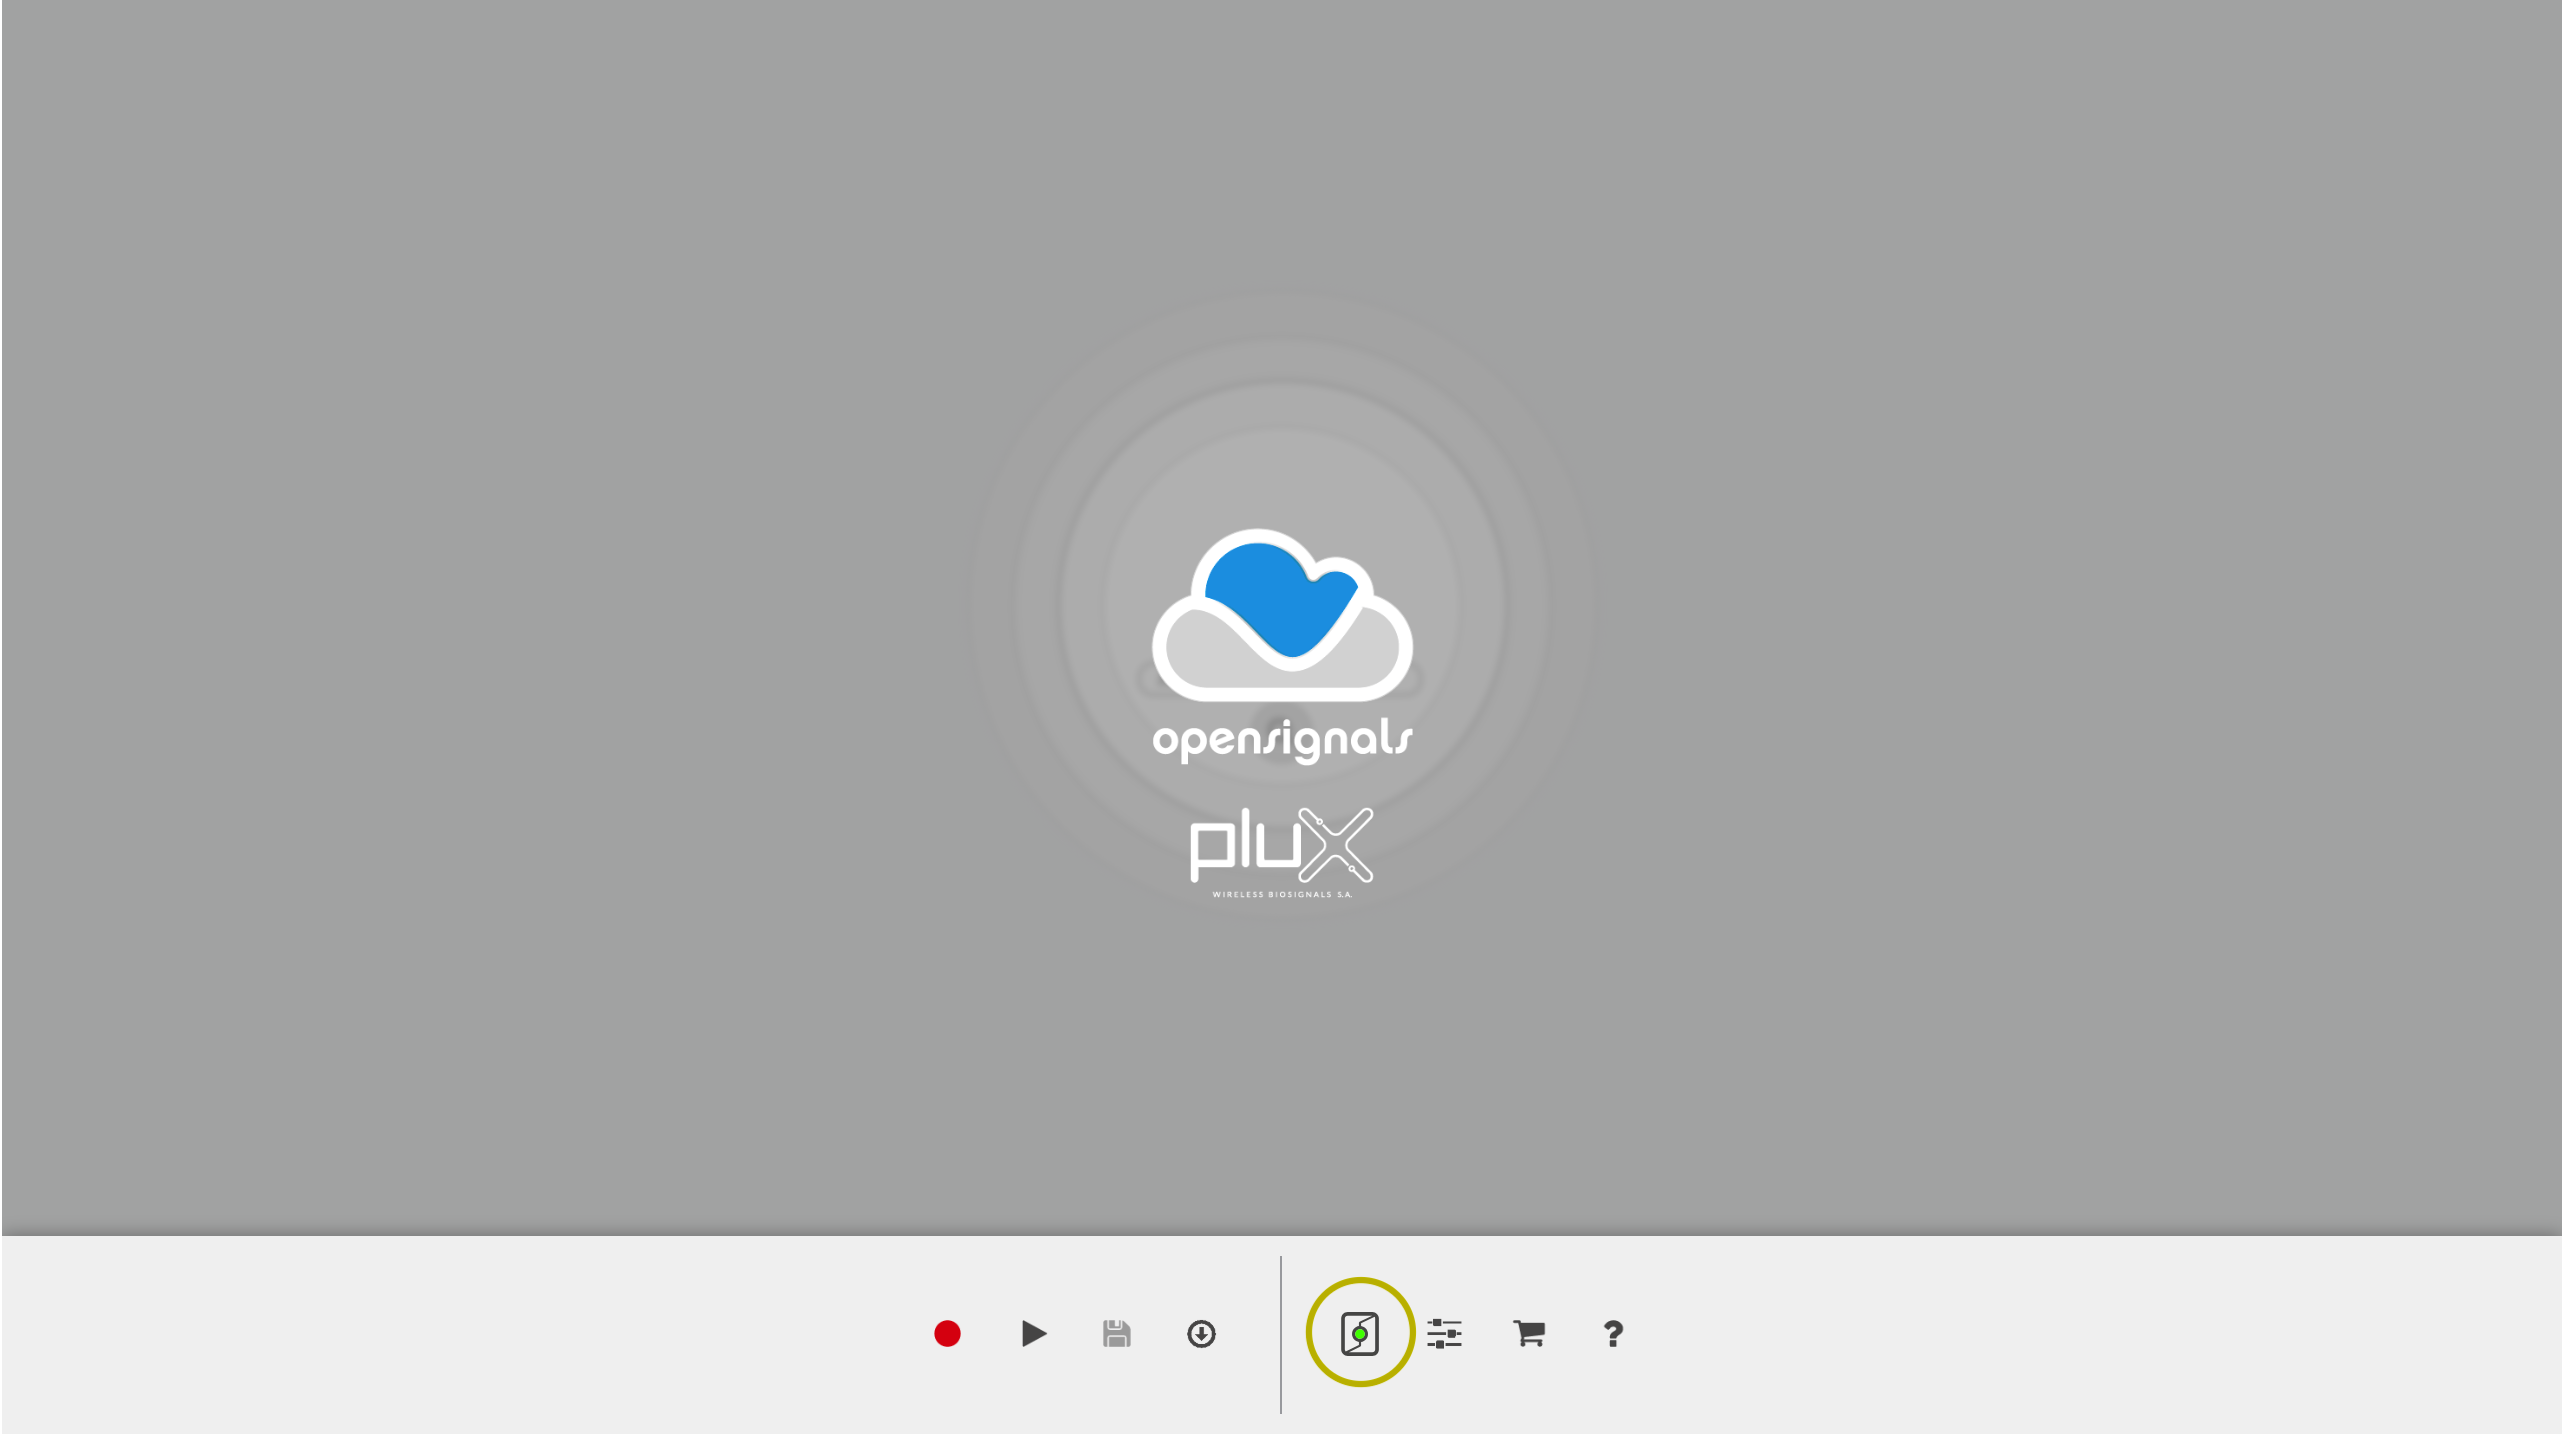
After establishing the Bluetooth connection, open the OpenSignals software and click on the device manager icon highlighted in the screenshot below (green circle) where you should find your BITalino now.
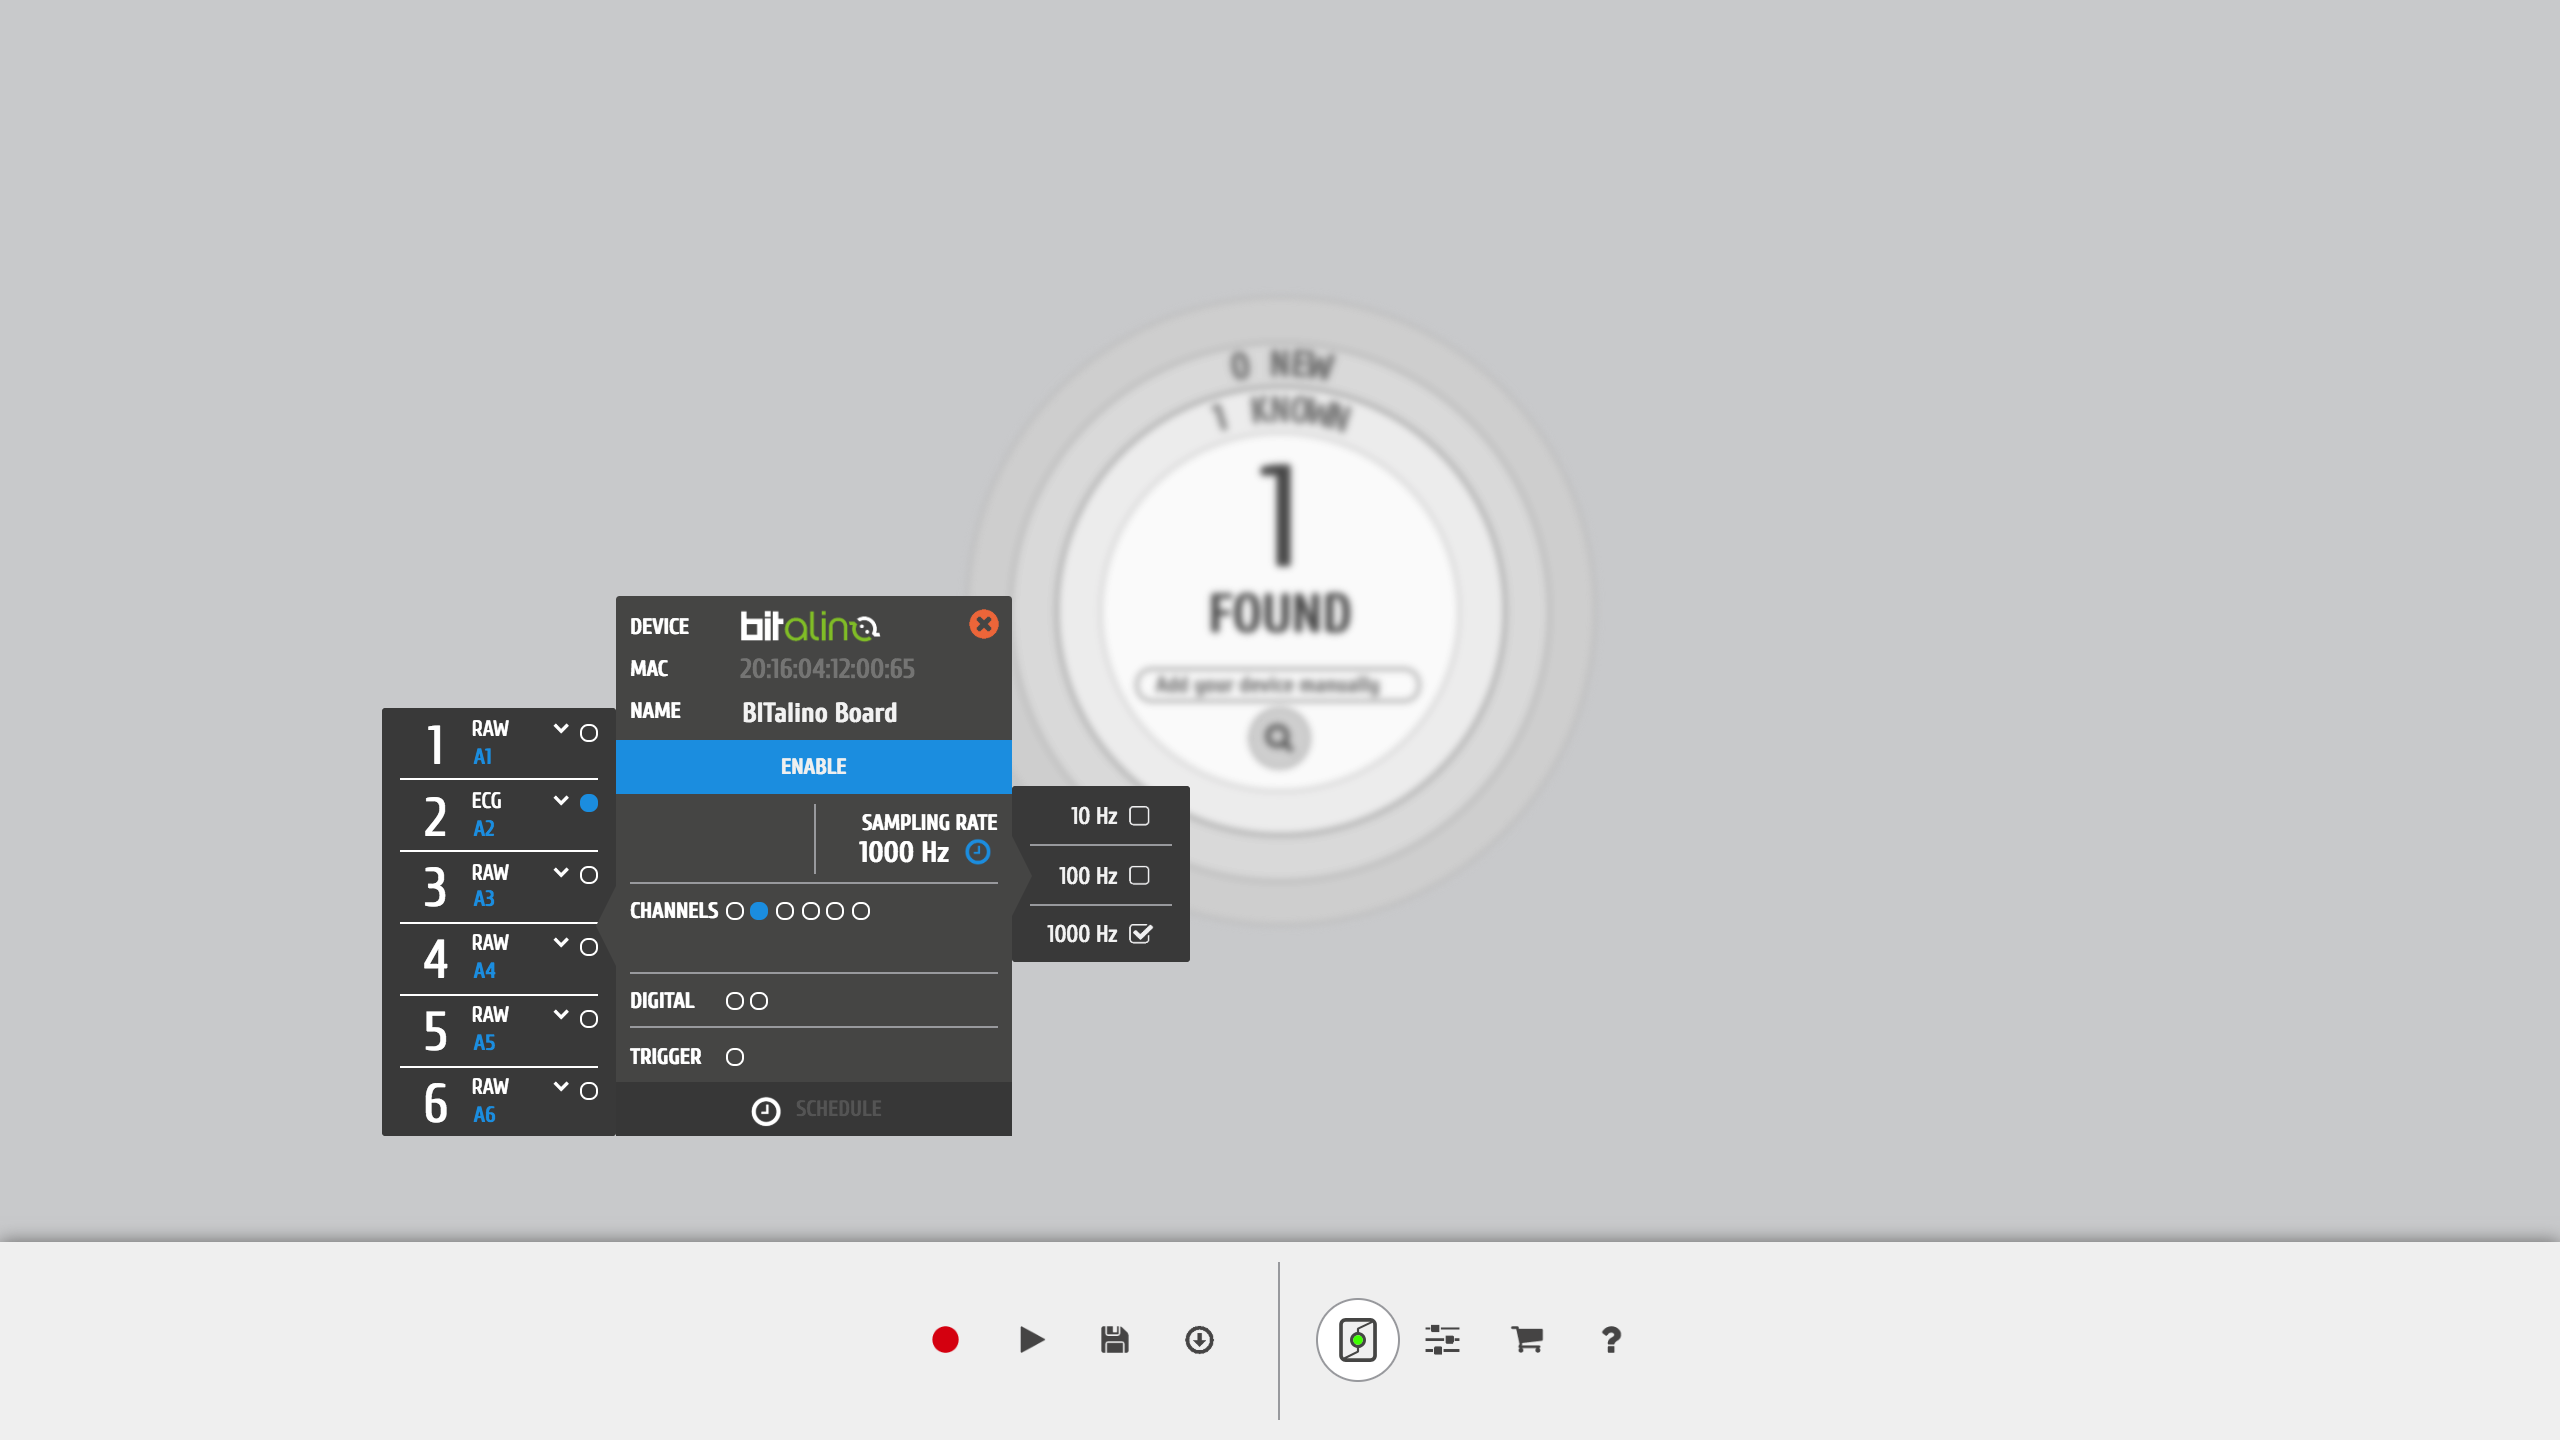
Click on the BITalino panel, select ECG from the dropdown menu of channel 2 and click on the circle on the left (must turn blue) to activate this channel for acquisition. Finally, click on the ENABLE button (must turn blue) to select your BITalino as acquisition device.
Your device panel should now look like the device panel seen in the screenshot below (you can ignore the configuration of the remaining channels).
Note
Click on the magnifying glass icon in the center of the device manager to search for your device, if your BITalino is not listed shown yet.
3.2.3. Step 3: Connecting the Electrodes and Sensor
The BITalino ECG sensor is designed for single-lead ECG acquisitions according to the Einthoven leads. Visit the following forum thread of the BITalino forum to learn how place your electrodes:
http://forum.bitalino.com/viewtopic.php?t=135
Connect the 2 or 3 lead electrode cable to your electrodes and connect it with the ECG sensor of your BITalino board.
3.2.4. Step 4: Acquiring ECG Signals
After successfully configuring your BITalino in the OpenSignals software, we can now acquire ECG signals. For this, click on the record icon in the OpenSignals menu highlighted in the screenshot below (green circle).

Now, the connection between the software and your BITalino will be established, and the acquisition will start shortly after. The status LED of your BITalino will switch from fading into blinking when it enters the acquisition mode.
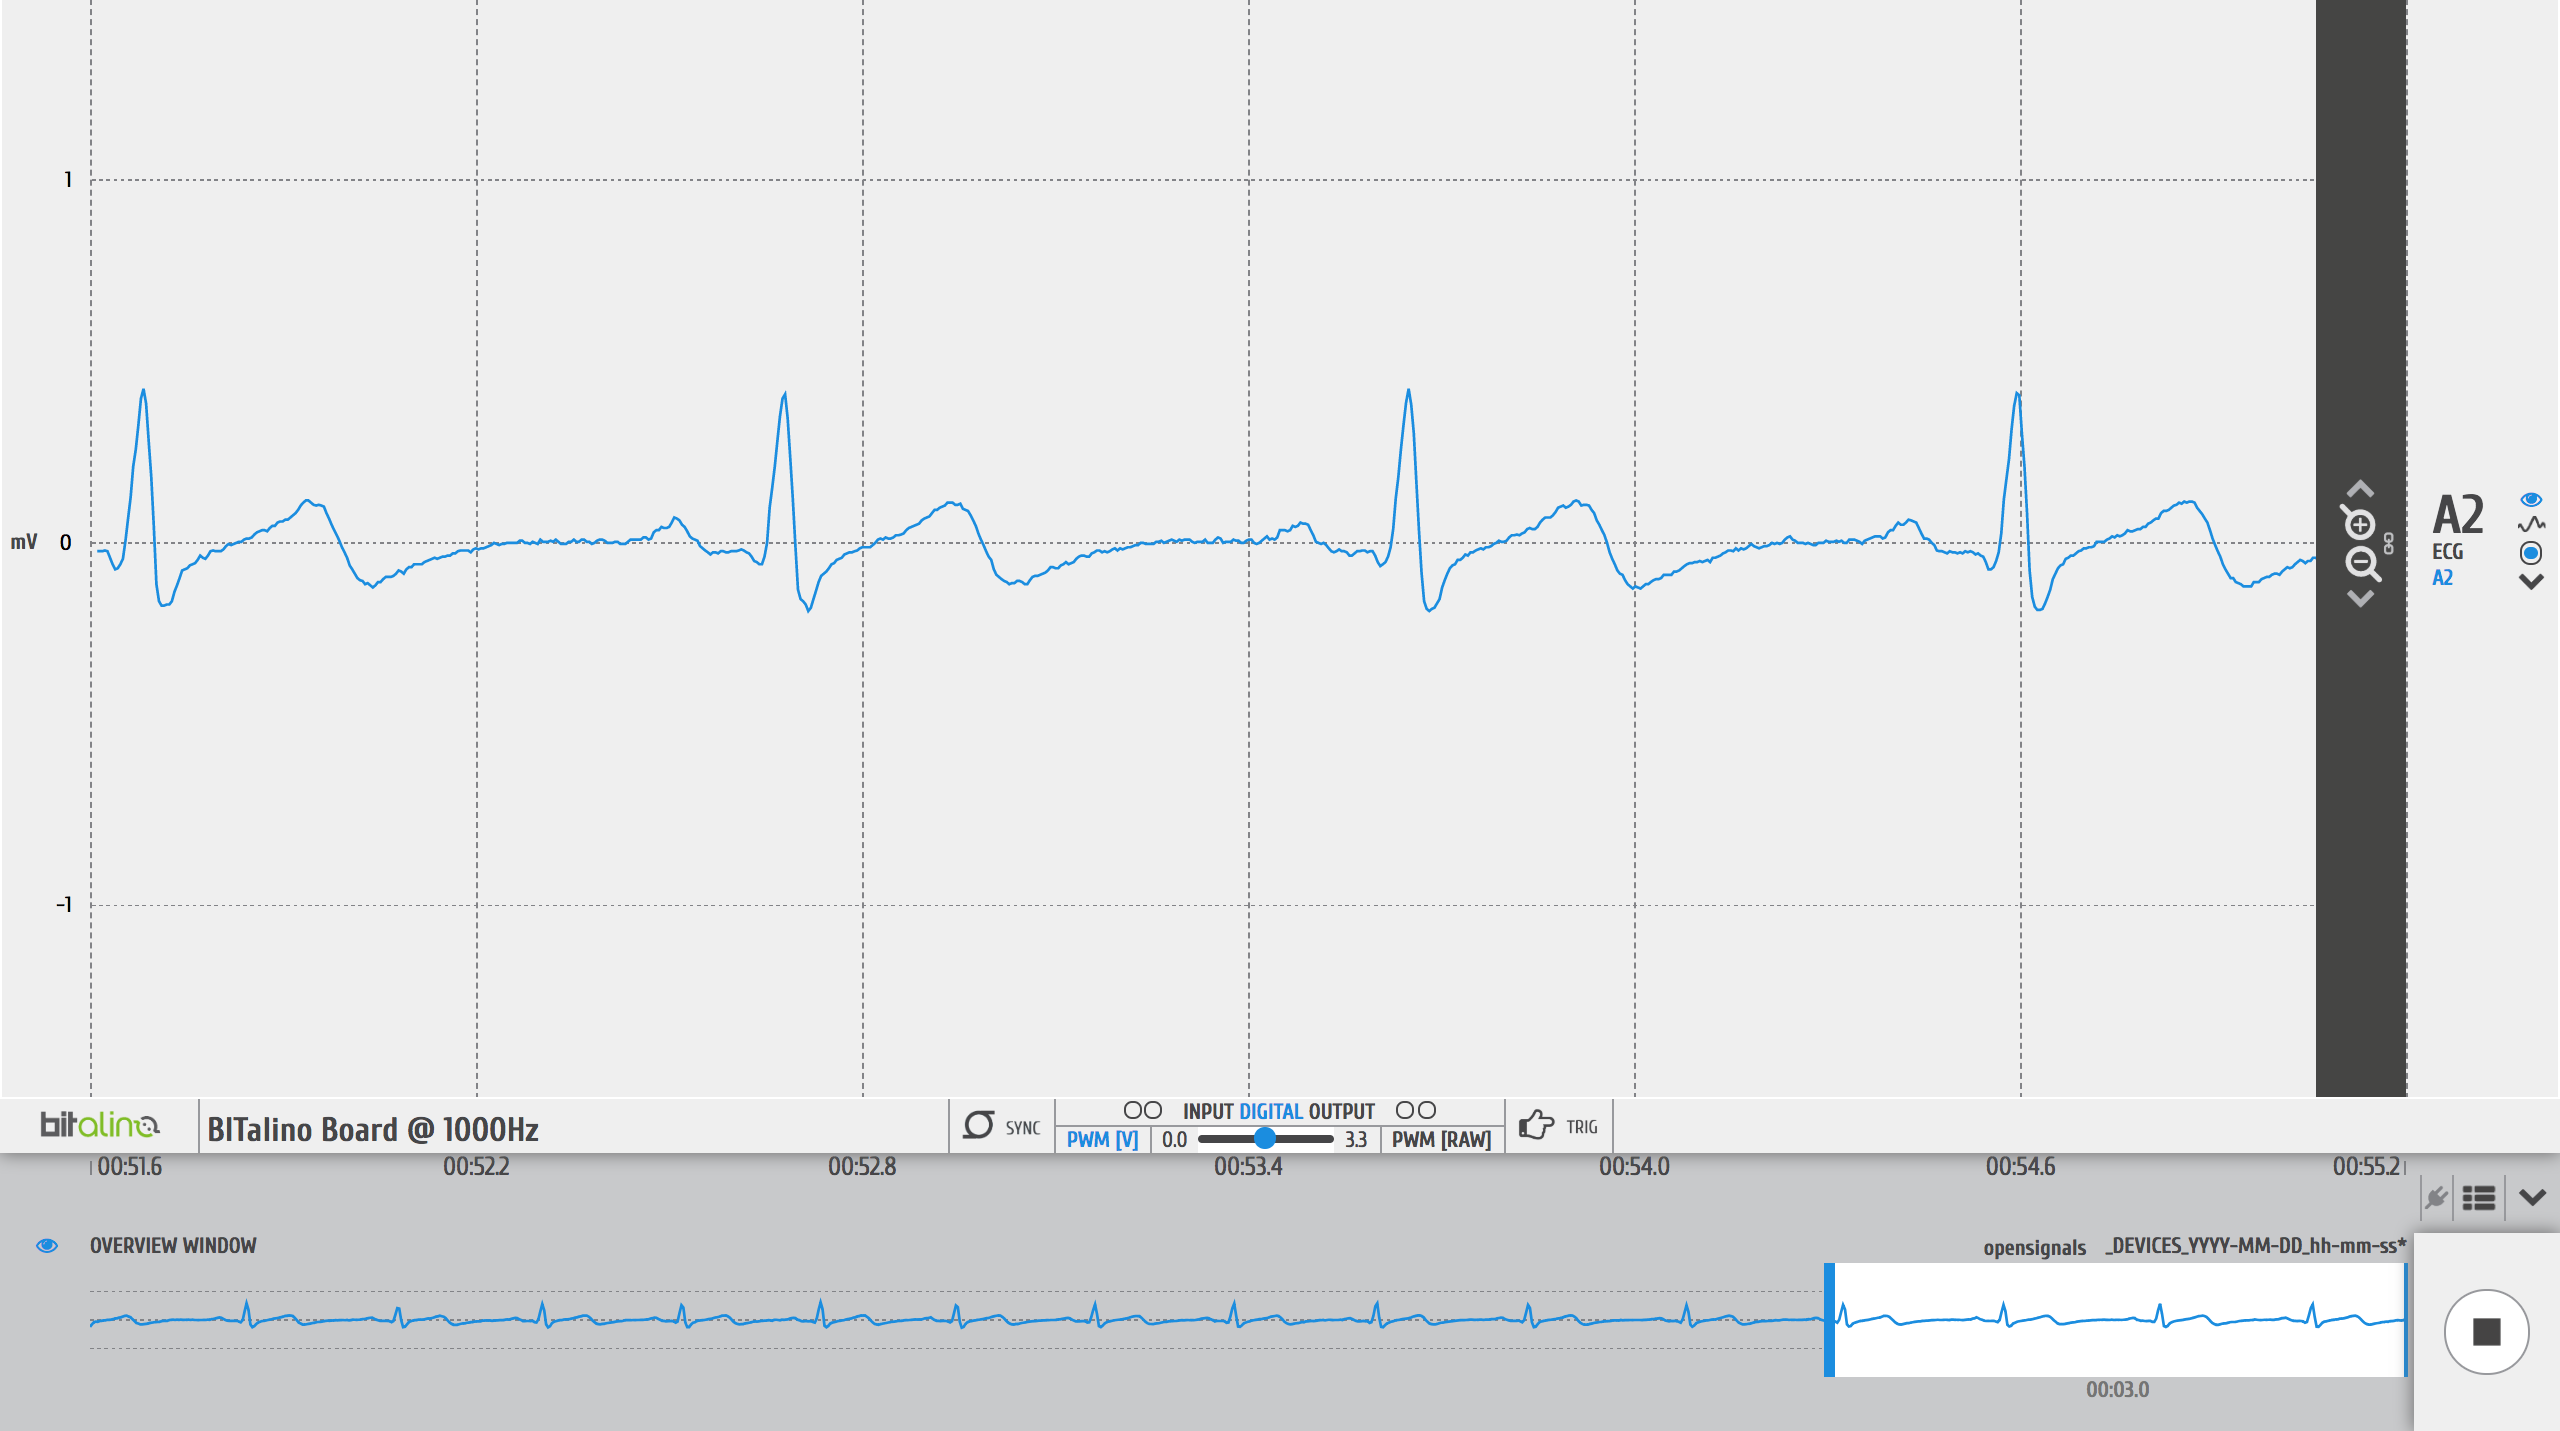
In the OpenSignals software, the ECG signal should be visualized as shown in the screenshot below:
3.2.5. Step 5: Loading OpenSignals Sensor Data
In this step, we will import the ECG signal acquired in the previous step using Python. If you haven’t done yet, create and open a new Python script in the IDE of your preference, and use the following code to import the ECG signal. Note, that we will also already import all the necessary packages for the upcoming steps.
# Import packages
from pyhrv.hrv import hrv
from opensignalsreader import OpenSignalsReader
from biosppy.signals.ecg import ecg

# Specify the file path of your OpenSignals file (absolute file path is recommended)
fpath = '/path/to/SampleECG.txt'

# Load the acquisition file
acq = OpenSignalsReader(fpath)

# Get the ECG signal
signal = acq.signal('ECG')
That’s it! Now that we have the acquired ECG signal stored in the signal variable, we can move on to the next step.
3.2.6. Step 6: Processing ECG Signal and Extracting R-Peaks
`BioSPPy is an open-source biosignal processing toolkit<https://github.com/PIA-Group/BioSPPy>`_ which we will be
using us to filter our ECG signal (e.g. removing motion artifacts), and to extract the R-peak locations which are
needed for the HRV computation. We can do this using the biosppy.signals.ecg.ecg() function.
This function returns a series of datasets and parameters, however, we are only interested in the filtered ECG signal. Add the following line of code to the existing code of the previous step:
# Filter ECG signal
filtered_signal = ecg(signal)[1]
Note
You can also skip this step if you want to use any of the functions below as this this step is already integrated in these functions:
pyhrv.hrv()pyhrv.time_domain.time_domain()pyhrv.frequency_domain.frequency_domain()pyhrv.nonlinear.nonlinear()
In these cases, simply pass the ECG signal to the functions as follows:
pyhrv.hrv(signal=signal)
pyhrv.time_domain.time_domain(signal=signal)
pyhrv.frequency_domain.frequency_domain(signal=signal)
pyhrv.nonlinear.nonlinear(signal=signal)
For all the other functions, pass the R-peak locations or the NNI series to the functions.
3.2.7. Step 7: Compute HRV Parameters
In this final step, we will use the pyhrv.hrv.hrv() function to compute all the HRV parameters of this toolbox and
have a short look on how to compute individual parameters or methods from the different domains.
To compute all available HRV parameters with the default parameters, add the following line to your code:
# Compute all HRV parameters with default input parameters
results = hrv(signal=filtered_signal)
Note
Set the show input parameter of the pyhrv.hrv.hrv() function to True if you want to display all the
generated plots.
# Compute all HRV parameters with default input parameters and show all plot figures
results = pyhrv.hrv(signal=signal, show=True)
Important
You might have to close all generated plot figures to allow the execution of the upcoming code sections. Alternatively, turn on the interactive mode of the matplotlib package to prevent this issue.
You can now print the results and see all the computed parameters using:
print(results)
However, if you want list the parameters in a more reader-friendly format, it is better to loop through all the available keys and parameters and print them one at a time using:
# Print all the parameters keys and values individually
for key in results.keys():
   print(key, results[key])
That’s it! We have successfully recorded an ECG signal, processed it and computed the HRV parameters with only a few lines of code.
3.2.8. Tl;dr - The Entire Script
The code sections we have generated over the course of this tutorial are summarized in the following Python script:
# Import packages
import pyhrv.tools as tools
from pyhrv.hrv import hr
from opensignalsreader import OpenSignalsReader
from biosppy.signals.ecg import ecg

# Specify the file path of your OpenSignals file (absolute file path is recommended)
fpath = '/path/to/SampleECG.txt'

# Load the acquisition file
acq = OpenSignalsReader(fpath)

# Get the ECG signal
signal = acq.signal('ECG')

# Filter ECG signal and extract the R-peak locations
filtered_signal = ecg(signal)[1]

# Compute all HRV parameters with default input parameters
results = hrv(signal=filtered_signal)

# Print all the parameters keys and values individually
for key in results.keys():
   print(key, results[key])

# Create HRV report in .TXT format
hrv_report(results, path='/my/favorite/path', rfile='MyFirstHRVReport')
Note
Any feedback or ideas how to improve this tutorial? Feel free to share your ideas or questions with me via e-mail: pgomes92@gmail.com