2.3. Time Domain Module
The time_domain.py module contains all the functions to compute the HRV time domain parameters.
See also
Module Contents
- Time Domain Module
2.3.1. NNI Parameters: nni_parameters()
-
pyhrv.time_domain.nni_parameters(nni=None, rpeaks=None)
Function Description
Computes basic statistical parameters from a series of NN intervals (# of intervals, mean, min, max).
- Input Parameters
nni(array): NN intervals in [ms] or [s].rpeaks(array): R-peak times in [ms] or [s].
Returns (ReturnTuple Object)
The results of this function are returned in a biosppy.utils.ReturnTuple object. Use the following keys below (on the left) to index the results:
nni_counter(int): Number of NNI (-)nni_mean(float): Mean NNI [ms]nni_min(int): Minimum NNI [ms]nni_max(int): Maximum NNI [ms]
See also
Application Notes
It is not necessary to provide input data for nni and rpeaks. The parameter(s) of this function will be computed with any of the input data provided (nni or rpeaks). nni will be prioritized in case both are provided.
nni or rpeaks data provided in seconds [s] will automatically be converted to nni data in milliseconds [ms].
See also
Section NN Format: nn_format() for more information.
Examples & Tutorials
The following example code demonstrates how to use this function and how access the results stored in the returned biosppy.utils.ReturnTuple object.
You can use NNI series (nni) to compute the parameters:
# Import packages
import pyhrv
import pyhrv.time_domain as td

# Load sample data
nni = pyhrv.utils.load_sample_nni()

# Compute parameters
results = td.nni_parameters(nni)

# Print minimum NNI
print(results['nni_min'])
Alternatively, you can use R-peak series (rpeaks) data to compute the NNI parameters.
# Import packages
import biosppy
import pyhrv.time_domain as td

# Load sample ECG signal
signal = np.loadtxt('./files/SampleECG.txt')[:, -1]

# Get R-peaks series using biosppy
t, filtered_signal, rpeaks = biosppy.signals.ecg.ecg(signal)[:3]

# Compute parameters using R-peak series
results = td.nni_parameters(rpeaks=t[rpeaks])
2.3.2. ∆NNI Parameters: nni_differences_parameters()
-
pyhrv.time_domain.nni_differences_parameters(nni=None, rpeaks=None)
Function Description
Computes basic statistical parameters from a series of NN interval differences (# of intervals, mean, min, max).
- Input Parameters
nni(array): NN intervals in [ms] or [s].rpeaks(array): R-peak times in [ms] or [s].
Returns (ReturnTuple Object)
The results of this function are returned in a biosppy.utils.ReturnTuple object. Use the following keys below (on the left) to index the results:
nni_diff_mean(float): Mean NNI difference [ms]nni_diff_min(int): Minimum NNI difference [ms]nni_diff_max(int): Maximum NNI difference [ms]
See also
Application Notes
It is not necessary to provide input data for nni and rpeaks. The parameter(s) of this function will be computed with any of the input data provided (nni or rpeaks). nni will be prioritized in case both are provided.
nni or rpeaks data provided in seconds [s] will automatically be converted to nni data in milliseconds [ms].
See also
Section NN Format: nn_format() for more information.
Examples & Tutorials
The following example code demonstrates how to use this function and how access the results stored in the returned biosppy.utils.ReturnTuple object.
You can use NNI series (nni) to compute the parameters:
# Import packages
import pyhrv
import pyhrv.time_domain as td

# Load sample data
nni = pyhrv.utils.load_sample_nni()

# Compute parameters
results = td.nni_differences_parameters(nni)

# Print maximum NNI difference
print(results['nni_diff_max'])
Alternatively, you can use R-peak series (rpeaks) data to compute the ∆NNI parameters.
# Import packages
import biosppy
import pyhrv.time_domain as td

# Load sample ECG signal
signal = np.loadtxt('./files/SampleECG.txt')[:, -1]

# Get R-peaks series using biosppy
t, filtered_signal, rpeaks = biosppy.signals.ecg.ecg(signal)[:3]

# Compute parameters using R-peak series
results = td.nni_differences_parameters(rpeaks=t[rpeaks])
2.3.3. Heart Rate Parameters: hr_parameters()
-
pyhrv.time_domain.hr_parameters(nni=None, rpeaks=None)
Function Description
Computes basic statistical parameters from a series of heart rate (HR) data (mean, min, max, standard deviation)
- Input Parameters
nni(array): NN intervals in [ms] or [s].rpeaks(array): R-peak times in [ms] or [s].
Returns (ReturnTuple Object)
The results of this function are returned in a biosppy.utils.ReturnTuple object. Use the following keys below (on the left) to index the results:
hr_mean(float): Mean heart rate [bpm]hr_min(int): Minimum heart rate [bpm]hr_max(int): Maximum heart rate [bpm]hr_std(float): Standard deviation of the heart rate series [bpm]
See also
Computation
The Heart Rate series is computed as follows:
for \(0 <= j <= n\)
with:
- \(HR_j\): Heart rate j (in [bpm])
- \(NNI_j\): NN interval j (in [ms])
- \(n\): Number of NN intervals
See also
Application Notes
It is not necessary to provide input data for nni and rpeaks. The parameter(s) of this function will be computed with any of the input data provided (nni or rpeaks). nni will be prioritized in case both are provided.
nni or rpeaks data provided in seconds [s] will automatically be converted to nni data in milliseconds [ms].
See also
Section NN Format: nn_format() for more information.
Examples & Tutorials
The following example code demonstrates how to use this function and how access the results stored in the returned biosppy.utils.ReturnTuple object.
You can use NNI series (nni) to compute the parameters:
# Import packages
import pyhrv
import pyhrv.time_domain as td

# Load sample data
nni = pyhrv.utils.load_sample_nni()

# Compute parameters
results = td.hr_parameters(nni)

# Print maximum HR
print(results['hr_max'])
Alternatively, you can use R-peak series (rpeaks) to compute the HR parameters.
# Import packages
import biosppy
import pyhrv.time_domain as td

# Load sample ECG signal
signal = np.loadtxt('./files/SampleECG.txt')[:, -1]

# Get R-peaks series using biosppy
t, filtered_signal, rpeaks = biosppy.signals.ecg.ecg(signal)[:3]

# Compute parameters using R-peak series
results = td.hr_parameters(rpeaks=t[rpeaks])
2.3.4. SDNN: sdnn()
-
pyhrv.time_domain.sdnn(nni=None, rpeaks=None)
Function Description
Computes the Standard Deviation of a NN interval series (SDNN).
- Input Parameters
nni(array): NN intervals in [ms] or [s].rpeaks(array): R-peak times in [ms] or [s].
Returns (ReturnTuple Object)
The results of this function are returned in a biosppy.utils.ReturnTuple object. Use the following key below (on the left) to index the results:
sdnn(float): Standard deviation of NN intervals [ms]
See also
Parameter Computation
The SDNN parameter is computed according to the following formula:
- with:
- \(n\): Number of NNI
- \(NNI_j\): NNI j
- \(\overline{NNI}\): Mean of NNI series
Application Notes
It is not necessary to provide input data for nni and rpeaks. The parameter(s) of this function will be computed with any of the input data provided (nni or rpeaks). nni will be prioritized in case both are provided.
nni or rpeaks data provided in seconds [s] will automatically be converted to nni data in milliseconds [ms].
See also
Section NN Format: nn_format() for more information.
Examples & Tutorials
The following example code demonstrates how to use this function and how access the results stored in the returned biosppy.utils.ReturnTuple object.
You can use NNI series (nni) to compute the SDNN parameter:
# Import packages
import pyhrv
import pyhrv.time_domain as td

# Load sample data
nni = pyhrv.utils.load_sample_nni()

# Compute SDNN parameter
results = td.sdnn(nni)

# Print SDNN
print(results['sdnn'])
Alternatively, you can use R-peak series (rpeaks):
# Import packages
import biosppy
import pyhrv.time_domain as td

# Load sample ECG signal
signal = np.loadtxt('./files/SampleECG.txt')[:, -1]

# Get R-peaks series using biosppy
t, filtered_signal, rpeaks = biosppy.signals.ecg.ecg(signal)[:3]

# Compute parameter using R-peak series
results = td.sdnn(rpeaks=t[rpeaks])
2.3.5. SDNN Index: sdnn_index()
-
pyhrv.time_domain.sdnn_index(nni=None, rpeaks=None, full=False, duration=300, warn=True)
Function Description
Computes the SDNN Index of an NNI series with a specified segmentation duration of duration (300 seconds = 5 minutes by default).
- Input Parameters
nni(array): NN intervals in [ms] or [s].rpeaks(array): R-peak times in [ms] or [s].ßfull(bool, optional): If True, returns the last segment even if its duration is significantly shorter thanduration(default:False).duration(int, optional): Maximum duration per segment in [s] (default: 300 seconds)warn(bool, optional): If True, raise a warning message if a segmentation could not be conducted (duration > NNI series duration)
Note
full is False by default which causes the last segment to be dropped.
For instance, if processing an NNI series of 12.5min and the default segment duration of 5min, the segmentation function would split this series into 3 segments of 5min, 5min and 2.5min in duration. In this case, the last segment greatly alters the SDNN Index. Set the full parameter to False to drop the last segment or to True to compute the SDNN Index even with shorter segments.
Use the warn input argument to decide whether you want to see warning messages in the Python terminal, which would appear if a segmentation of the signal could not be conducted (e.g. duration > NNI duration).
Returns (ReturnTuple Object)
The results of this function are returned in a biosppy.utils.ReturnTuple object. Use the following key below (on the left) to index the results:
sdnn_index(float): SDNN Index [ms]
See also
Parameter Computation
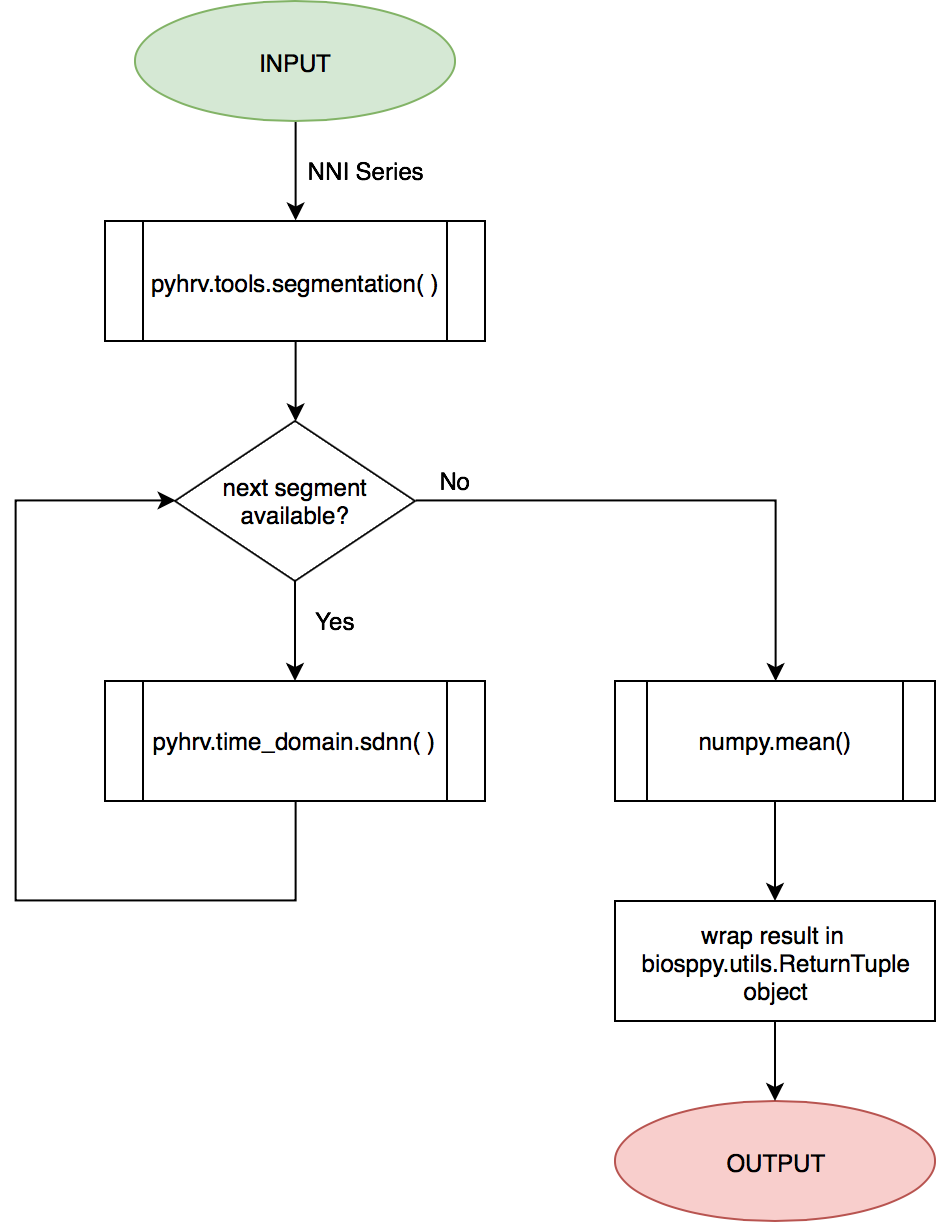
The SDNN Index is computed using the pyhrv.time_domain.sdnn() and the pyhrv.tools.segmentation() functions.
See also
First, the input NNI series is segmented into segments of ~5 minutes in duration. Second, the SDNN parameter of each segment is computed. Finally, the mean value of all computed SDNN values is computed.
These steps are presented in the flow chart below.
Application Notes
It is not necessary to provide input data for nni and rpeaks. The parameter(s) of this function will be computed with any of the input data provided (nni or rpeaks). nni will be prioritized in case both are provided.
nni or rpeaks data provided in seconds [s] will automatically be converted to nni data in milliseconds [ms].
See also
Section NN Format: nn_format() for more information.
Examples & Tutorials
The following example code demonstrates how to use this function and how access the results stored in the returned biosppy.utils.ReturnTuple object.
You can use NNI series (nni) to compute the SDNN parameter:
# Import packages
import pyhrv
import pyhrv.time_domain as td

# Load sample data
nni = pyhrv.utils.load_sample_nni()

# Compute SDNN Index parameter
results = td.sdnn_index(nni)

# Print SDNN index
print(results['sdnn_index'])
Alternatively, you can use R-peak series (rpeaks) to compute the SDNN Index:
# Import packages
import biosppy
import pyhrv.time_domain as td

# Load sample ECG signal
signal = np.loadtxt('./files/SampleECG.txt')[:, -1]

# Get R-peaks series using biosppy
t, filtered_signal, rpeaks = biosppy.signals.ecg.ecg(signal)[:3]

# Compute parameter using R-peak series
results = td.sdnn_index(rpeaks=t[rpeaks])
2.3.6. SDANN: sdann()
-
pyhrv.time_domain.sdann(nni=None, rpeaks=None, full=False, duration=300, warn=True)
Function Description
Computes the SDANN of an NNI series with a specified segmentation duration of duration (300s=5min by default).
- Input Parameters
nni(array): NN intervals in [ms] or [s].rpeaks(array): R-peak times in [ms] or [s].ßfull(bool, optional): If True, returns the last segment even if its duration is significantly shorter thanduration(default:False).duration(int, optional): Maximum duration per segment in [s] (default: 300 seconds)warn(bool, optional): If True, raise a warning message if a segmentation could not be conducted (duration > NNI series duration)
Note
full is False by default which causes the last segment to be dropped.
For instance, if processing an NNI series of 12.5min and the default segment duration of 5min, the segmentation function would split this series into 3 segments of 5min, 5min and 2.5min in duration. In this case, the last segment greatly alter the SDNN Index. Set the full parameter to False to drop the last segment or to True to compute the SDNN Index even with shorter segments.
Use the warn input argument to decide whether you want to see warning messages in the Python terminal, which would appear if a segmentation of the signal could not be conducted (e.g. duration > NNI duration).
Returns (ReturnTuple Object)
The results of this function are returned in a biosppy.utils.ReturnTuple object. Use the following key below (on the left) to index the results:
sdann(float): SDANN [ms]
See also
Parameter Computation
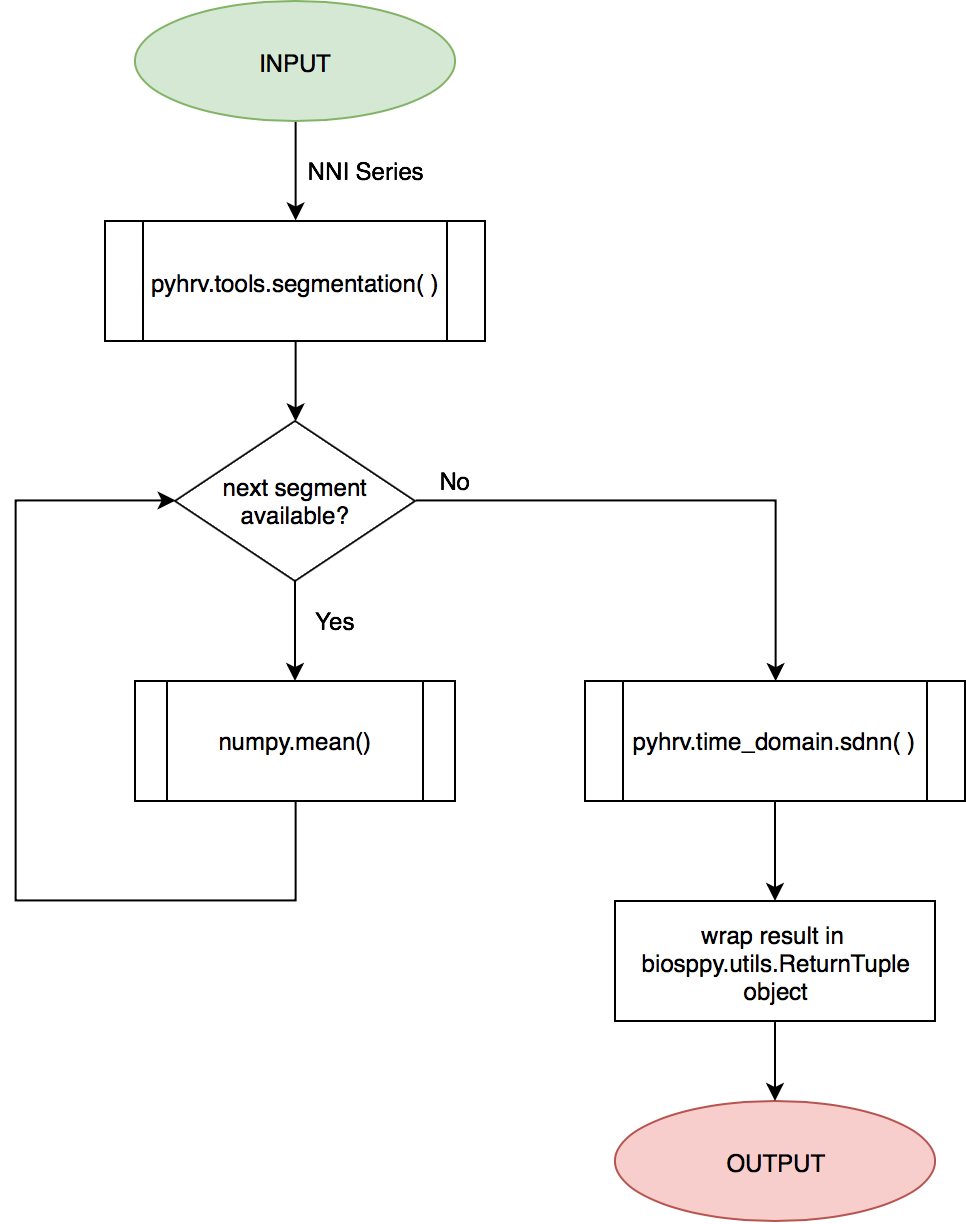
The SDANN is computed using the pyhrv.time_domain.sdnn() and the pyhrv.tools.segmentation() functions.
See also
First, the input NNI series is segmented into segments of ~5 minutes in duration. Second, the mean of each segment is computed. Finally, the SDNN value of all computed mean values is computed.
These steps are presented in the flow chart below.
Application Notes
It is not necessary to provide input data for nni and rpeaks. The parameter(s) of this function will be computed with any of the input data provided (nni or rpeaks). nni will be prioritized in case both are provided.
nni or rpeaks data provided in seconds [s] will automatically be converted to nni data in milliseconds [ms].
See also
Section NN Format: nn_format() for more information.
Examples & Tutorials
The following example code demonstrates how to use this function and how access the results stored in the biosppy.utils.ReturnTuple object.
You can use NNI series (nni) to compute the SDANN parameter:
# Import packages
import pyhrv
import pyhrv.time_domain as td

# Load sample data
nni = pyhrv.utils.load_sample_nni()

# Compute SDANN parameter
results = td.sdann(nni)

# Print SDANN
print(results['sdann'])
Alternatively, you can use R-peak series (rpeaks) to compute the SDANN:
# Import packages
import biosppy
import pyhrv.time_domain as td

# Load sample ECG signal
signal = np.loadtxt('./files/SampleECG.txt')[:, -1]

# Get R-peaks series using biosppy
t, filtered_signal, rpeaks = biosppy.signals.ecg.ecg(signal)[:3]

# Compute parameter using R-peak series
results = td.sdann(rpeaks=t[rpeaks])
2.3.7. RMSSD: rmssd()
-
pyhrv.time_domain.rmssd(nni=None, rpeaks=None)
Function Description
Computes the root mean of squared NNI differences.
- Input Parameters
nni(array): NN intervals in [ms] or [s].rpeaks(array): R-peak times in [ms] or [s].
Returns (ReturnTuple Object)
The results of this function are returned in a biosppy.utils.ReturnTuple object. Use the following key below (on the left) to index the results:
The results of this function are returned in a biosppy.utils.ReturnTuple object. Use the following key below (on the left) to index the results:
rmssd(float): Root mean of squared NNI differences [ms]
See also
Parameter Computation
The RMSSD parameter is computed according to the following formula:
- with:
- \(n\): Number of NNI
- \(\Delta NNI_j\): NNI differences
Application Notes
It is not necessary to provide input data for nni and rpeaks. The parameter(s) of this function will be computed with any of the input data provided (nni or rpeaks). nni will be prioritized in case both are provided.
nni or rpeaks data provided in seconds [s] will automatically be converted to nni data in milliseconds [ms].
See also
Section NN Format: nn_format() for more information.
Examples & Tutorials
The following examples demonstrate how to use this function and how access the results stored in the biosppy.utils.ReturnTuple object using the output key ‘rmssd’.
You can use NNI series (nni) to compute the RMSSD parameter:
# Import packages
import pyhrv
import pyhrv.time_domain as td

# Load sample data
nni = pyhrv.utils.load_sample_nni()

# Compute RMSSD parameter
results = td.rmssd(nni)

# Print RMSSD
print(results['rmssd'])
Alternatively, you can use R-peak series (rpeaks):
# Import packages
import biosppy
import pyhrv.time_domain as td

# Load sample ECG signal
signal = np.loadtxt('./files/SampleECG.txt')[:, -1]

# Get R-peaks series using biosppy
t, filtered_signal, rpeaks = biosppy.signals.ecg.ecg(signal)[:3]

# Compute parameter using R-peak series
results = td.rmssd(rpeaks=t[rpeaks])
2.3.8. SDSD: sdsd()
-
pyhrv.time_domain.sdsd(nni=None, rpeaks=None)
Function Description
Standard deviation of NNI differences.
- Input Parameters
nni(array): NN intervals in [ms] or [s].rpeaks(array): R-peak times in [ms] or [s].
Returns (ReturnTuple Object)
The results of this function are returned in a biosppy.utils.ReturnTuple object. Use the following key below (on the left) to index the results:
sdsd(float): Standard deviation of NNI differences [ms]
See also
Parameter Computation
The SDSD parameter is computed according to the following formula:
- with:
- \(n\): Number of NNI
- \(\Delta NNI_j\): NNI differences
- \(\overline{NNI}\): Mean NNI
Application Notes
It is not necessary to provide input data for nni and rpeaks. The parameter(s) of this function will be computed with any of the input data provided (nni or rpeaks). nni will be prioritized in case both are provided.
nni or rpeaks data provided in seconds [s] will automatically be converted to nni data in milliseconds [ms].
See also
Section NN Format: nn_format() for more information.
Examples & Tutorials
The following examples demonstrate how to use this function and how access the results stored in the biosppy.utils.ReturnTuple object using the output key ‘sdsd’.
You can use NNI series (nni) to compute the SDSD parameter:
# Import packages
import pyhrv
import pyhrv.time_domain as td

# Load sample data
nni = pyhrv.utils.load_sample_nni()

# Compute SDSD parameter
results = td.sdsd(nni)

# Print SDSD
print(results['sdsd'])
Alternatively, you can use R-peak series (rpeaks):
# Import packages
import biosppy
import pyhrv.time_domain as td

# Load sample ECG signal
signal = np.loadtxt('./files/SampleECG.txt')[:, -1]

# Get R-peaks series using biosppy
t, filtered_signal, rpeaks = biosppy.signals.ecg.ecg(signal)[:3]

# Compute parameter using R-peak series
results = td.sdsd(rpeaks=t[rpeaks])
2.3.9. NNXX: nnXX()
-
pyhrv.time_domain.nnXX(nni=None, rpeaks=None, threshold=None)
Function Description
Derives the NNXX parameters: Finds number of NN interval differences greater than a specified threshold XX and the ratio between number of intervals > threshold and the total number of NN interval differences.
Hint
Other than the nn50() and the NN20() functions which derive the NNXX parameters based on 50 millisecond and 20 millisecond
threshold, you can use this function to apply custom temporal thresholds.
- Input Parameters
nni(array): NN intervals in [ms] or [s].rpeaks(array): R-peak times in [ms] or [s].threshold(int): threshold for nnXX values in [ms].
Returns (ReturnTuple Object)
The results of this function are returned in a biosppy.utils.ReturnTuple object. Use the following keys below (on the left) to index the results:
nnXX(int): Number of NN interval differences greater than the specified thresholdpnnXX(float): Ratio between nnXX and total number of NN interval differences
See also
Important
The XX in the nnXX and the pnnXX keys are replaced by the specified threshold.
For example, nnXX(nni, threshold=30) returns the custom nn30 and pnn30 parameters. Applying threshold=35 as nnXX(nni, threshold=35) returns the custom nn35 and pnn35 parameters.
# Code example with a threshold of 30ms
results30 = nnXX(nni, threshold=30)
print(results30['nn30'])

# Code example with a threshold of 35ms
results35 = nnXX(nni, threshold=35)
print(results35['nn35'])
- Exceptions
TypeError: If no threshold is specified.ValueError: Threshold <= 0.
Parameter Computation
This parameter computes the NNI differences series from the NNI (nni) or (rpeaks) data and derives the
NNXX parameter (nnXX) where it counts all the NNI differences that are greater than the specified threshold
(threshold).
The pnnXX parameters is computed as follows:
with:
- \(pnnXX\): Ratio of NNI differences > threshold and \(n\)
- \(nnXX\): Number of NNI differences > threshold XX
- \(n\): Number of NNI differences
Application Notes
It is not necessary to provide input data for nni and rpeaks. The parameter(s) of this function will be computed with any of the input data provided (nni or rpeaks). nni will be prioritized in case both are provided.
nni or rpeaks data provided in seconds [s] will automatically be converted to nni data in milliseconds [ms].
See also
Section NN Format: nn_format() for more information.
Examples & Tutorials
The following examples demonstrate how to use this function and how access the results stored in the biosppy.utils.ReturnTuple object.
Specify the threshold of your preference using the threshold input parameter.
You can use NNI series (nni) to compute the nnXX parameters:
# Import packages
import pyhrv
import pyhrv.time_domain as td

# Load sample data
nni = pyhrv.utils.load_sample_nni()

# Compute NNXX parameters using the NNI series and a threshold of 30ms
results30 = nnXX(nni, threshold=30)
print(results30['nn30']

# Compute NNXX parameters using the NNI series and a threshold of 35ms
results35 = nnXX(nni, threshold=35)
print(results35['nn35'])
Alternatively, you can use R-peak series (rpeaks):
# Import packages
import biosppy
import pyhrv.time_domain as td

# Load sample ECG signal
signal = np.loadtxt('./files/SampleECG.txt')[:, -1]

# Get R-peaks series using biosppy
t, filtered_signal, rpeaks = biosppy.signals.ecg.ecg(signal)[:3]

# Compute NNXX parameters using the R-peak series and a threshold of 30ms
results30 = nnXX(rpeaks=t[rpeaks], threshold=30)
print(results30['nn30']

# Compute NNXX parameters using the R-peak series and a threshold of 35ms
results35 = nnXX(rpeaks=r[rpeaks], threshold=35)
print(results35['nn35'])
2.3.10. NN50: nn50()
-
pyhrv.time_domain.nn50(nni=None, rpeaks=None)
Function Description
Derives the NN50 parameters: Finds number of NN interval differences greater than 50ms (NN50) and the ratio between NN50 and the total number of NN interval differences.
Hint
Use the nnXX() function (NNXX: nnXX()) to compute NNXX parameters with custom thresholds.
- Input Parameters
nni(array): NN intervals in [ms] or [s].rpeaks(array): R-peak times in [ms] or [s].
Returns (ReturnTuple Object)
The results of this function are returned in a biosppy.utils.ReturnTuple object. Use the following keys below (on the left) to index the results:
nn50(int): Number of NN interval differences greater 50 millisecondspnn50(float): Ratio between NN50 and total number of NN intervals
See also
Parameter Computation
This parameter computes the NNI differences series from the NNI (nni) or (rpeaks) data and derives the
NN50 parameter (nn50) where it counts all the NNI differences that are greater than 50ms.
The pnn50 parameters is computed as follows:
with:
- \(pNNXX\): Ratio of NNI differences > 50 milliseconds and \(n\)
- \(NNXX\): Number of NNI differences > 50 milliseconds
- \(n\): Number of NNI differences
Note
This function computes the parameters using the nnXX() function (NNXX: nnXX()).
Application Notes
It is not necessary to provide input data for nni and rpeaks. The parameter(s) of this function will be computed with any of the input data provided (nni or rpeaks). nni will be prioritized in case both are provided.
nni or rpeaks data provided in seconds [s] will automatically be converted to nni data in milliseconds [ms].
See also
Section NN Format: nn_format() for more information.
Examples & Tutorials
The following examples demonstrate how to use this function and how access the results stored in the biosppy.utils.ReturnTuple object.
You can use NNI series (nni) to compute the nn50 parameters:
# Import packages
import pyhrv
import pyhrv.time_domain as td

# Load sample data
nni = pyhrv.utils.load_sample_nni()

# Compute NN50 parameters using the NNI series
results30 = nn50(nni)
print(results50['nn50'])
print(results50['pnn50'])
Alternatively, you can use R-peak series (rpeaks):
# Import packages
import biosppy
import pyhrv.time_domain as td

# Load sample ECG signal
signal = np.loadtxt('./files/SampleECG.txt')[:, -1]

# Get R-peaks series using biosppy
t, filtered_signal, rpeaks = biosppy.signals.ecg.ecg(signal)[:3]

# Compute NN50 parameters using the R-peak series
results30 = nn50(rpeaks=t[rpeaks])
print(results['nn50'])
print(results['pnn50'])
2.3.11. NN20: nn20()
-
pyhrv.time_domain.nn20(nni=None, rpeaks=None)
Function Description
Derives the NN20 parameters: Finds number of NN interval differences greater than 20ms (NN20) and the ratio between NN20 and the total number of NN interval differences.
Hint
Use the nnXX() function (NNXX: nnXX()) to compute NNXX parameters with custom thresholds.
- Input Parameters
nni(array): NN intervals in [ms] or [s].rpeaks(array): R-peak times in [ms] or [s].
Returns (ReturnTuple Object)
The results of this function are returned in a biosppy.utils.ReturnTuple object. Use the following keys below (on the left) to index the results:
nn20(int): Number of NN interval differences greater 20 millisecondspNN20(float): Ratio between NN20 and total number of NN intervals
See also
Parameter Computation
This parameter computes the NNI differences series from the NNI (nni) or (rpeaks) data and derives the
NN20 parameter (nn20) where it counts all the NNI differences that are greater than 20ms.
The pnn20 parameters is computed as follows:
with:
- \(pNNXX\): Ratio of NNI differences > 20 milliseconds and \(n\)
- \(NNXX\): Number of NNI differences > 20 milliseconds
- \(n\): Number of NNI differences
Note
This function computes the parameters using the nnXX() function (NNXX: nnXX()).
Application Notes
It is not necessary to provide input data for nni and rpeaks. The parameter(s) of this function will be computed with any of the input data provided (nni or rpeaks). nni will be prioritized in case both are provided.
nni or rpeaks data provided in seconds [s] will automatically be converted to nni data in milliseconds [ms].
See also
Section NN Format: nn_format() for more information.
Examples & Tutorials
The following examples demonstrate how to use this function and how access the results stored in the biosppy.utils.ReturnTuple object.
You can use NNI series (nni) to compute the nn20 parameters:
# Import packages
import pyhrv
import pyhrv.time_domain as td

# Load sample data
nni = pyhrv.utils.load_sample_nni()

# Compute NN20 parameters using the NNI series
results = nn20(nni)
print(results['nn20'])
print(results['pnn20'])
Alternatively, you can use R-peak series (rpeaks):
# Import packages
import biosppy
import pyhrv.time_domain as td

# Load sample ECG signal
signal = np.loadtxt('./files/SampleECG.txt')[:, -1]

# Get R-peaks series using biosppy
t, filtered_signal, rpeaks = biosppy.signals.ecg.ecg(signal)[:3]

# Compute NN20 parameters using the R-peak series
results = nn20(rpeaks=t[rpeaks])
print(results['nn20'])
print(results['pnn20'])
2.3.12. Geometrical Parameters
The geometrical parameters are computed based on the NNI histogram distribution. The TINN and Triangular Index are, in most cases, provided together. However, pyHRV provides individual functions to individually compute the TINN (pyhrv.time_domain.tinn()) and Triangular Index (pyhrv.time_domain.triangular_index()) parameters.
Additionally, the pyhrv.time_domain.geometrical_parameters() function allows you to compute all geometrical parameters and to join them in a single NNI histogram using only a single function.
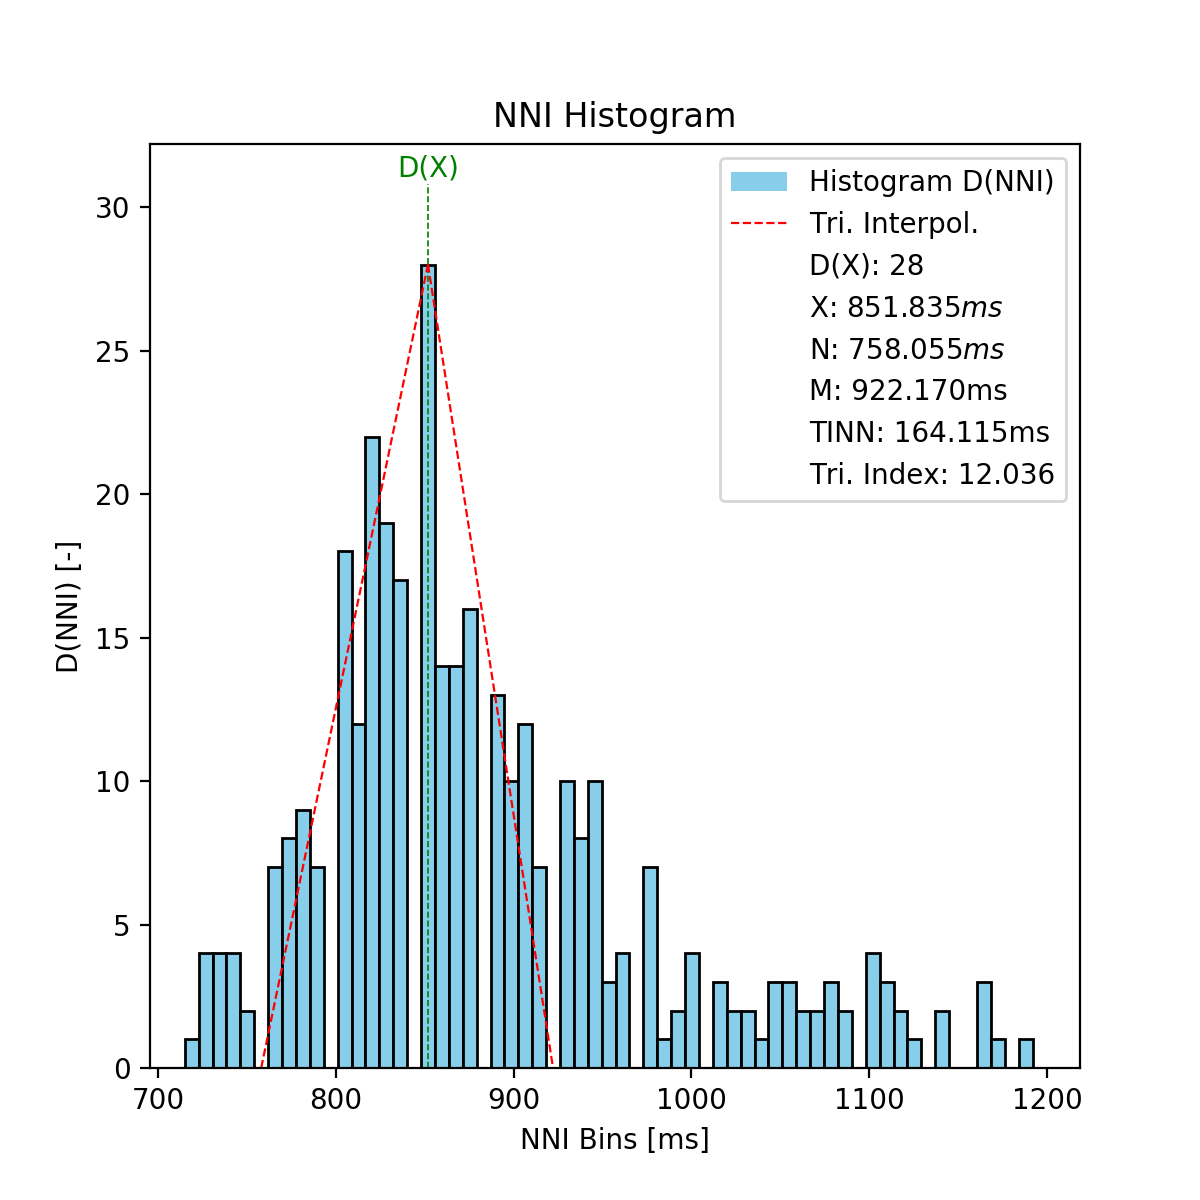
2.3.12.1. TINN: tinn()
-
pyhrv.time_domain.tinn(nni=None, rpeaks=None, binsize=7.8125, plot=True, show=True, figsize=None, legend=True)
Function Description
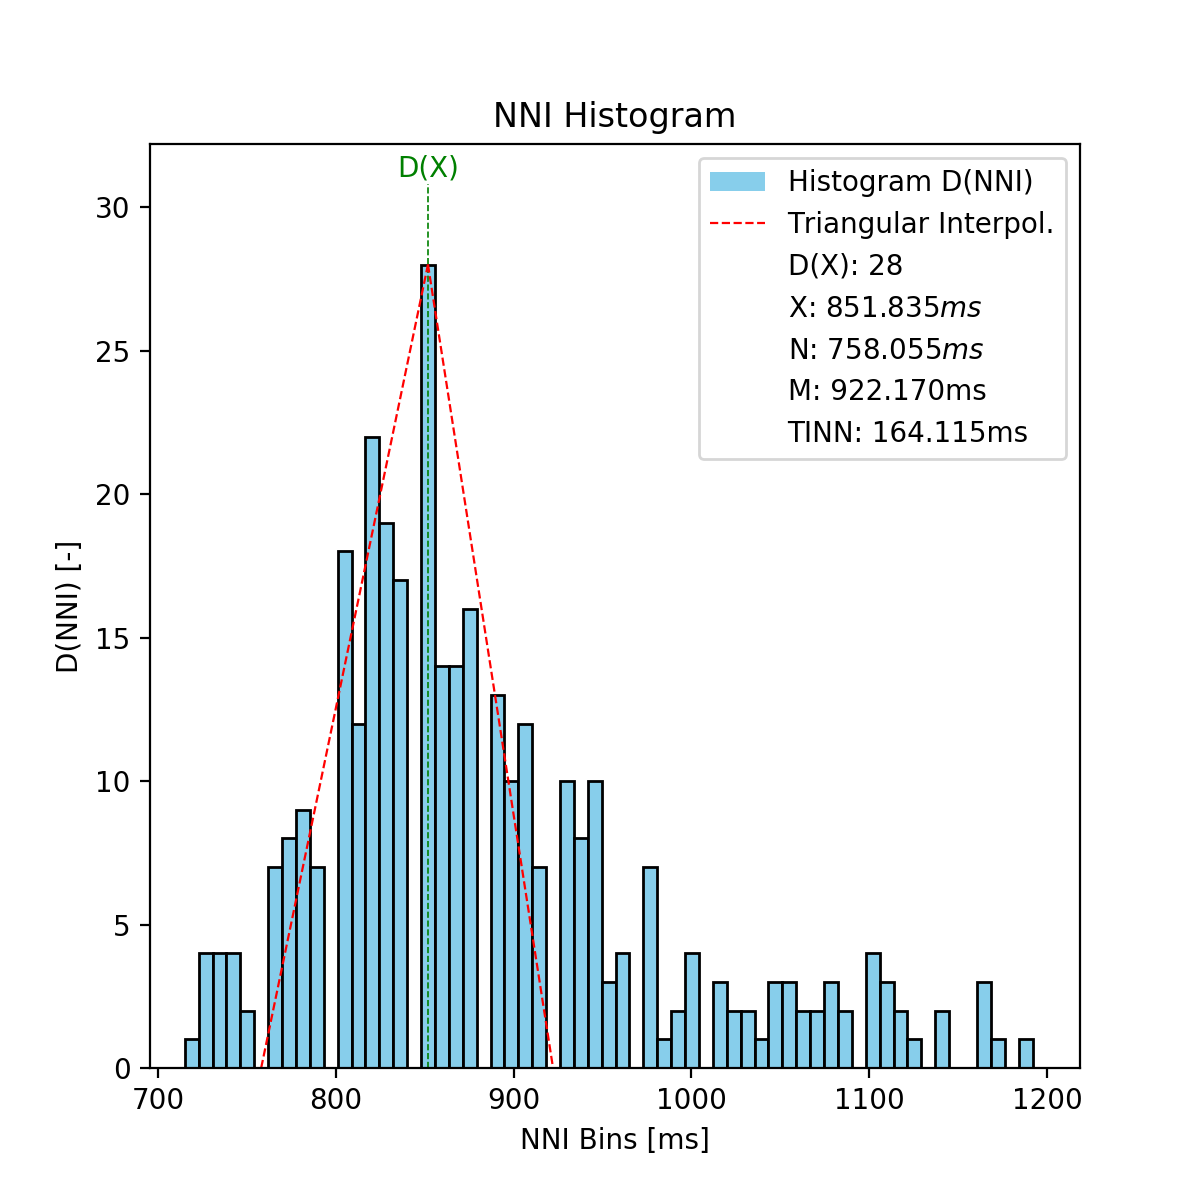
This function fits an interpolated triangle to the NNI histogram and computes its baseline width. See Parameter Computation below for detailed information about the computation. As result, an NNI histogram (plot) as shown below is computed.
- Input Parameters
nni(array): NN intervals in [ms] or [s].rpeaks(array): R-peak times in [ms] or [s].binsize(int, float, optional): Bin size of the histogram bins in [ms] (default: 7.8125 milliseconds).plot(bool, optional): If True, create the histogram plot figure usingmatplotlib. If False, the histogram data is computed usingnumpywith generating a histogram plot figure (default: True).show(bool, optional): If True, shows the histogram plot figure (default: True).figsize(array, optional): 2-element array with thematplotlibfigure sizefigsize. Format:figsize=(width, height)(default: will be set to (6, 6) if input is None).legend(bool, optional): If True, adds legend to the histogram plot figure (default: True).
Note
The binsize is pre-defined at 7.8125ms and is determined from the minimum suitable sampling frequency for ECG signals of 128Hz as recommended by the HRV Guidelines.
At this sampling frequency, the temporal resolution of the signal used to derive NNI series is limited at 7.8125ms (= 1/128Hz).
Returns (ReturnTuple Object)
The results of this function are returned in a biosppy.utils.ReturnTuple object. Use the following keys below (on the left) to index the results:
tinn_histogram(matplotlib figure object): Histogram plot figure (only if input parameterplotis Truetinn_n(float): N value of the TINN computation (left corner of the interpolated triangle at (N, 0))tinn_m(float): M value of the TINN computation (right corner of the interpolated triangle at (M, 0))tinn(float): TINN (baseline width of the interpolated triangle) [ms]
See also
Parameter Computation
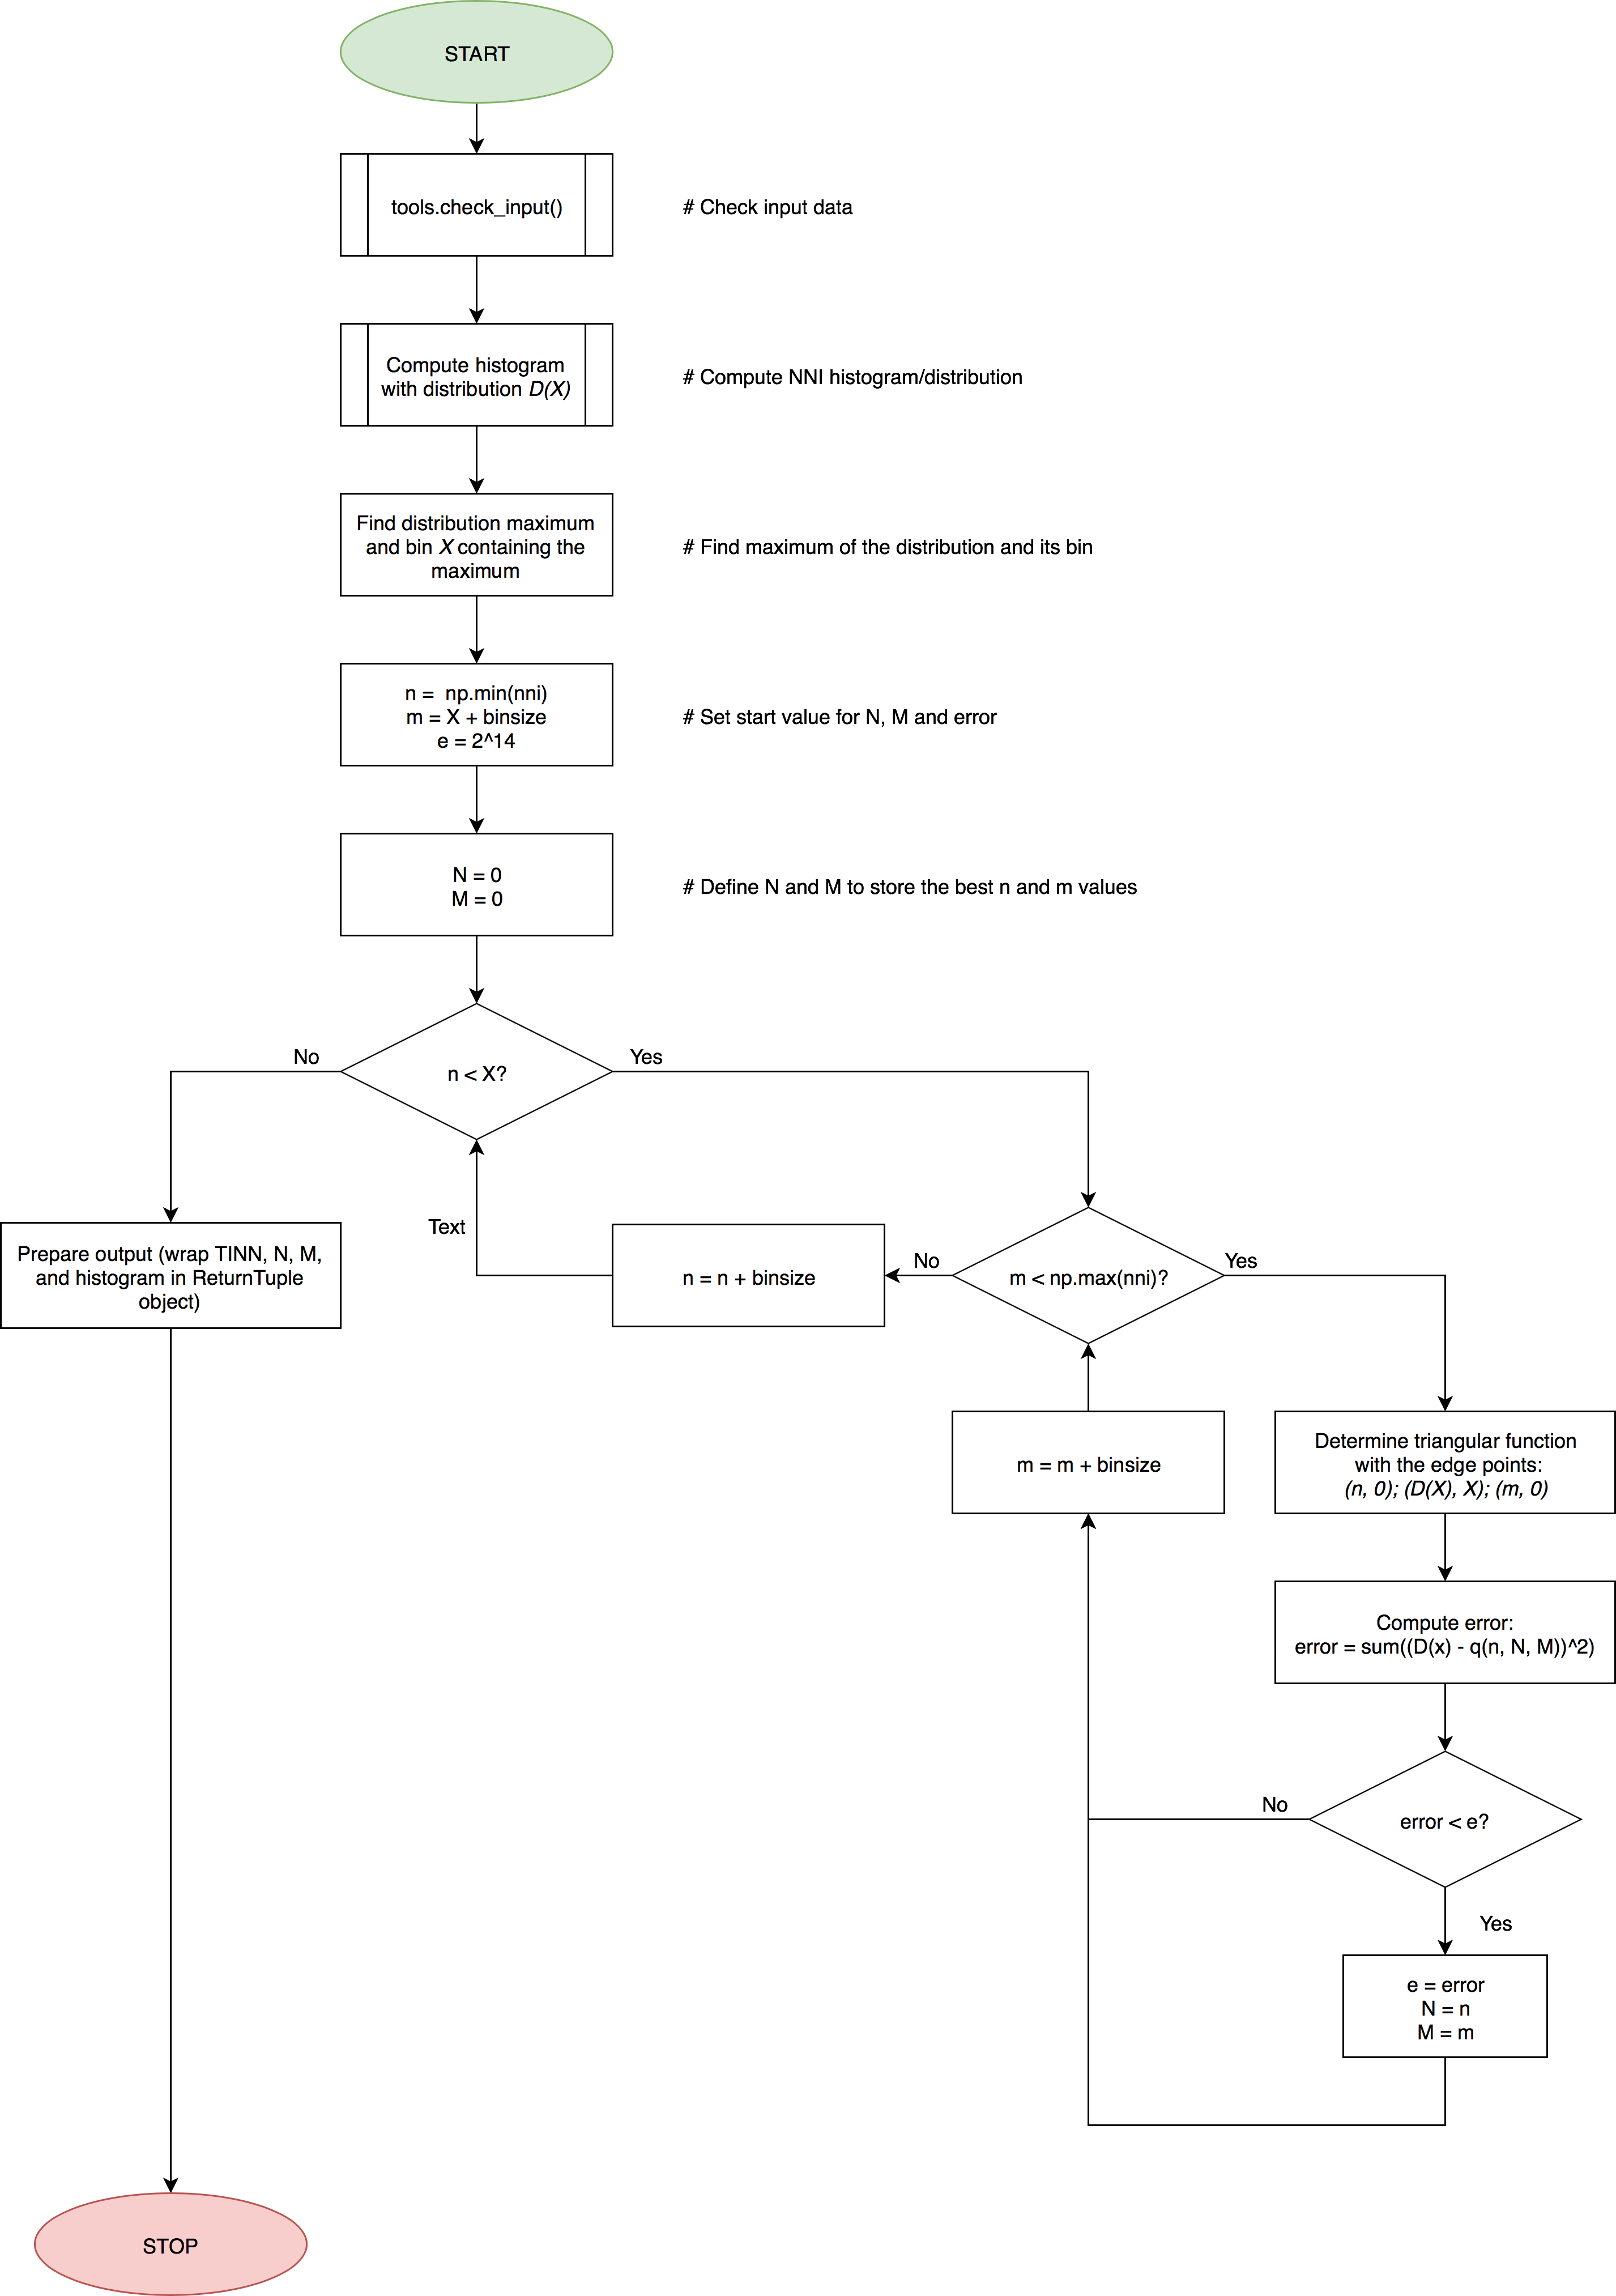
The TINN parameters are computed based on the interpolation of a triangle into the NNI distribution. The positioning of the triangle’s edges are determined by the following procedure: The first edge is positioned at the point (D(X), X) with D(X) being the histogram’s maximum and X the bin containing the maximum. The other two edges are positioned at the points (N, 0) and (M, 0). Finally, N and M are determined by finding the interpolated triangle with the best fit to the NNI histogram using the least squares method, as presented by the following formula:
- with:
- \(E(n)\): Error of the triangular interpolation with the best fit to the distribution
- \(D(X)\): NNI distribution
- \(q(n, N, m)\): Triangular interpolation function
- \(n\): Bin
- \(N\): N value determining the left corner of the interpolated triangle
- \(N_{min}\): Lowest bin where \(D(x) != 0\)
- \(M\): M value determining the right corner of the interpolated triangle
- \(M_{min}\): Highest bin where \(D(x) != 0\)
The main flow of this function is presented in the following flowchart:
Application Notes
It is not necessary to provide input data for nni and rpeaks. The parameter(s) of this function will be
computed with any of the input data provided (nni or rpeaks). nni will be prioritized in case both
are provided.
nni or rpeaks data provided in seconds [s] will automatically be converted to nni data in milliseconds
[ms].
See also
Section NN Format: nn_format() for more information.
Use the legend input parameter to show or hide the legend in the histogram figure.
The show parameter only has effect if plot is set to True. If plot is False, no plot figure will be
generated, therefore, no figure can be shown using the show parameter.
Important
This function generates matplotlib plot figures which, depending on the backend you are using, can interrupt
your code from being executed whenever plot figures are shown. Switching the backend and turning on the
matplotlib interactive mode can solve this behavior.
In case it does not - or if switching the backend is not possible - close all the plot figures to proceed with the
execution of the rest your code after the plt.show().
Examples & Tutorials
The following examples demonstrate how to use this function and how access the results stored in the biosppy.utils.ReturnTuple object.
You can use NNI series (nni) to compute the TINN parameters:
# Import packages
import pyhrv
import pyhrv.time_domain as td

# Load sample data
nni = pyhrv.utils.load_sample_nni()

# Compute TINN parameters using the NNI series
results = td.tinn(nni)

# Print TINN and th N value
print(results['tinn'])
print(results['tinn_n'])
Alternatively, you can use R-peak series (rpeaks):
# Import packages
import biosppy
import pyhrv.time_domain as td

# Load sample ECG signal
signal = np.loadtxt('./files/SampleECG.txt')[:, -1]

# Get R-peaks series using biosppy
t, filtered_signal, rpeaks = biosppy.signals.ecg.ecg(signal)[:3]

# Compute TINN parameters using the R-peak series
results = td.tinn(rpeaks=t[rpeaks])
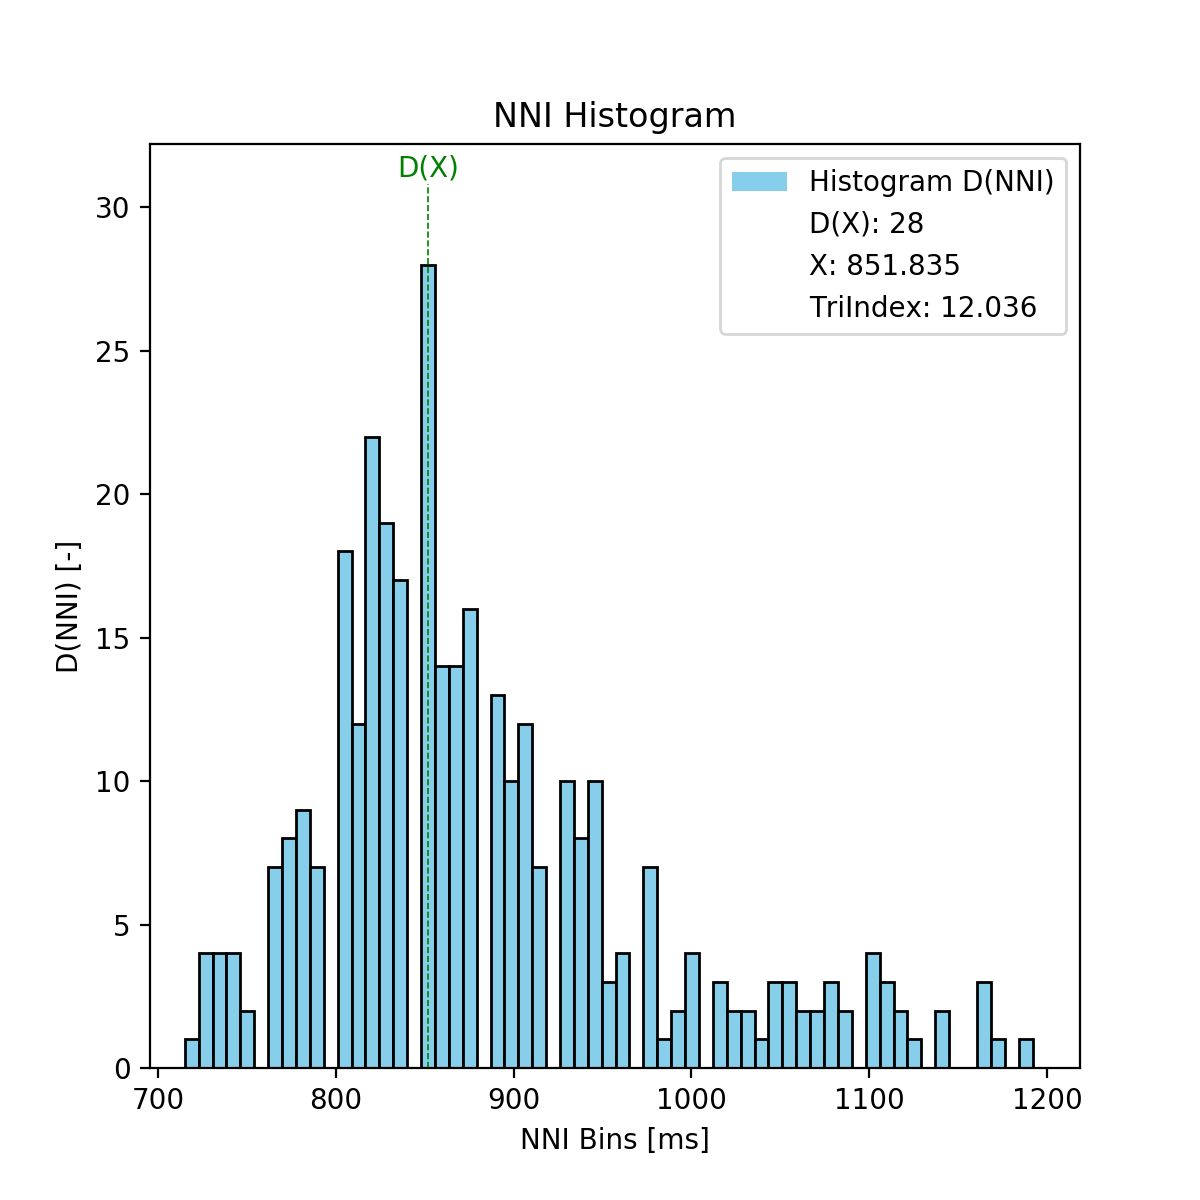
2.3.12.2. Triangular Index: triangular_index()
-
pyhrv.time_domain.triangular_index(nni=None, rpeaks=None, binsize=7.8125, plot=True, show=True, figsize=None, legend=True)
Function Description
Computes the triangular index based on the NN interval histogram.
- Input Parameters
nni(array): NN intervals in [ms] or [s].rpeaks(array): R-peak times in [ms] or [s].binsize(int, float, optional): Bin size of the histogram bins (default: 7.8125ms).plot(bool, optional): If True, create the histogram plot figure usingmatplotlib. If False, the histogram data is computed usingnumpywith generating a histogram plot figure (default: True).show(bool, optional): If True, shows the histogram plot figure (default: True).figsize(array, optional): 2-element array with thematplotlibfigure sizefigsize. Format:figsize=(width, height)(default: will be set to (6, 6) if input is None).legend(bool, optional): If True, adds legend to the histogram plot figure (default: True).
Note
The binsize is pre-defined at 7.8125ms and is determined from the minimum suitable sampling frequency for ECG signals of 128Hz as recommended by the HRV Guidelines.
At this sampling frequency, the temporal resolution of the signal used to derive NNI series is limited at 7.8125ms (= 1/128Hz).
Returns (ReturnTuple Object)
The results of this function are returned in a biosppy.utils.ReturnTuple object (see also The biosppy.utils.ReturnTuple Object. Use the following keys below (on the left) to index the results.
tri_histogram(matplotlib figure object): Histogram figure (only if input parameter ‘plot’ is True).tri_index(double): Triangular index.
See also
Parameter Computation
The Triangular Index is computed as the ratio between the total number of NNIs and the maximum of the NNI histogram distribution (D(x)).
with:
- \(Tri\): Triangular index
- \(n\): Number of NNI
- \(D(X)\): Maximum of the NNI distribution
Application Notes
It is not necessary to provide input data for nni and rpeaks. The parameter(s) of this function will be computed with any of the input data provided (nni or rpeaks). nni will be prioritized in case both are provided.
nni or rpeaks data provided in seconds [s] will automatically be converted to nni data in milliseconds [ms].
See also
Section NN Format: nn_format() for more information.
Use the legend input parameter to show or hide the legend in the histogram figure.
The show parameter only has effect if plot is set to True. If plot is False, no plot figure will be generated, therefore, no figure can be shown using the show parameter.
Important
This function generates matplotlib plot figures which, depending on the backend you are using, can interrupt
your code from being executed whenever plot figures are shown. Switching the backend and turning on the
matplotlib interactive mode can solve this behavior.
In case it does not - or if switching the backend is not possible - close all the plot figures to proceed with the
execution of the rest your code after the plt.show().
Examples & Tutorials
The following examples demonstrate how to use this function and how access the results stored in the biosppy.utils.ReturnTuple object.
You can use NNI series (nni) to compute the Triangular Index:
# Import packages
import pyhrv
import pyhrv.time_domain as td

# Load sample data
nni = pyhrv.utils.load_sample_nni()

# Compute Triangular Index using the NNI series
results = td.triangular_index(nni)

# Print Triangular Index
print(results['tri_index'])
Alternatively, you can use R-peak series (rpeaks):
# Import packages
import biosppy
import pyhrv.time_domain as td

# Load sample ECG signal
signal = np.loadtxt('./files/SampleECG.txt')[:, -1]

# Get R-peaks series using biosppy
t, filtered_signal, rpeaks = biosppy.signals.ecg.ecg(signal)[:3]

# Compute Triangular Index using the R-peak series
results = td.triangular_index(rpeaks=t[rpeaks])
2.3.12.3. Geometrical Parameters Function: geometrical_parameters()
-
pyhrv.time_domain.geometrical_parameters(nni=None, rpeaks=None, binsize=7.8125, plot=True, show=True, figsize=None, legend=True)
Function Description
Computes all the geometrical parameters based on the NNI histogram (Triangular Index, TINN, N, M) and returns them in a single histogram plot figure.
- Input Parameters
nni(array): NN intervals in [ms] or [s].rpeaks(array): R-peak times in [ms] or [s].binsize(int, float, optional): Bin size of the histogram bins (default: 7.8125ms).plot(bool, optional): If True, create the histogram plot figure usingmatplotlib. If False, the histogram data is computed usingnumpywith generating a histogram plot figure (default: True).show(bool, optional): If True, shows the histogram plot figure (default: True).figsize(array, optional): 2-element array with thematplotlibfigure sizefigsize. Format:figsize=(width, height)(default: will be set to (6, 6) if input is None).legend(bool, optional): If True, adds legend to the histogram plot figure (default: True).
Note
The binsize is pre-defined at 7.8125ms and is determined from the minimum suitable sampling frequency for ECG signals of 128Hz as recommended by the HRV Guidelines.
At this sampling frequency, the temporal resolution of the signal used to derive NNI series is limited at 7.8125ms (= 1/128Hz).
Returns (ReturnTuple Object)
The results of this function are returned in a biosppy.utils.ReturnTuple object (see also The biosppy.utils.ReturnTuple Object. Use the following keys below (on the left) to index the results.
nn_histogram(matplotlib figure object): Histogram plot figure (only if input parameterplotis Truetinn_n(float): N value of the TINN computation (left corner of the interpolated triangle at (N, 0))tinn_m(float): M value of the TINN computation (right corner of the interpolated triangle at (M, 0))tinn(float): TINN (baseline width of the interpolated triangle) [ms]tri_index(float): Triangular index [ms]
See also
Parameter Computation
See TINN: tinn() and Triangular Index: triangular_index() for detailed information.
Application Notes
It is not necessary to provide input data for nni and rpeaks. The parameter(s) of this function will be computed with any of the input data provided (nni or rpeaks). nni will be prioritized in case both are provided.
nni or rpeaks data provided in seconds [s] will automatically be converted to nni data in milliseconds
[ms].
See also
Section NN Format: nn_format() for more information.
Use the legend input parameter do show or hide the legend in the histogram figure.
The show parameter only has effect if plot is set to True. If plot is False, no plot figure will be generated, therefore, no figure can be shown using the show parameter.
Important
This function generates matplotlib plot figures which, depending on the backend you are using, can interrupt
your code from being executed whenever plot figures are shown. Switching the backend and turning on the
matplotlib interactive mode can solve this behavior.
In case it does not - or if switching the backend is not possible - close all the plot figures to proceed with the
execution of the rest your code after the plt.show().
Examples & Tutorials
The following examples demonstrate how to use this function and how access the results stored in the biosppy.utils.ReturnTuple object.
You can use NNI series (nni) to compute the Triangular Index:
# Import packages
import pyhrv
import pyhrv.time_domain as td

# Load sample data
nni = pyhrv.utils.load_sample_nni()

# Compute Geometrical Parameters using the NNI series
results = td.geometrical_parameters(nni)

# Print Geometrical Parameters
print(results['tri_index'])
print(results['tinn'])
Alternatively, you can use R-peak series (rpeaks):
# Import packages
import biosppy
import pyhrv.time_domain as td

# Load sample ECG signal
signal = np.loadtxt('./files/SampleECG.txt')[:, -1]

# Get R-peaks series using biosppy
t, filtered_signal, rpeaks = biosppy.signals.ecg.ecg(signal)[:3]

# Compute Geometrical Parameters using the R-peak series
results = td.geometrical_parameters(rpeaks=t[rpeaks])
2.3.13. Domain Level Function: time_domain()
-
pyhrv.time_domain.time_domain()
Function Description
Computes all time domain parameters of the HRV Time Domain module and returns them in a single ReturnTuple object.
See also
The individual parameter functions of this module for more detailed information about the computed parameters.
- Input Parameters
signal(array): ECG signalnni(array): NN intervals in [ms] or [s]rpeaks(array): R-peak times in [ms] or [s]sampling_rate(int, float, optional): Sampling rate in [Hz] used for the ECG acuqisition (default: 1000Hz)threshold(int, optional): Custom threshold in [ms] for the optional NNXX and pNNXX parameters (default: None)plot(bool, optional): If True, creates histogram using matploltib, else uses NumPy for histogram data only (geometrical parameters, default: True)show(bool, optional): If True, shows histogram plots.binsize(float, optional): Bin size in [ms] of the histogram bins - (geometrical params, default: 7.8125ms).
Important
This function computes the Time Domain parameters using either the signal, nni, or rpeaks data. Provide
only one type of data, as it is not required to pass all three types at once.
Returns (ReturnTuple Object)
The results of this function are returned in a biosppy.utils.ReturnTuple object. Use the following keys below (on the left) to index the results:
nni_counter(int): Number of NNI (-)nni_mean(float): Mean NNI [ms]nni_min(int): Minimum NNI [ms]nni_max(int): Maximum NNI [ms]nni_diff_mean(float): Mean NNI difference [ms]nni_diff_min(int): Minimum NNI difference [ms]nni_diff_max(int): Maximum NNI difference [ms]hr_mean(float): Mean heart rate [bpm]hr_min(int): Minimum heart rate [bpm]hr_max(int): Maximum heart rate [bpm]hr_std(float): Standard deviation of the heart rate series [bpm]sdnn(float): Standard deviation of NN intervals [ms]sdnn_index(float): SDNN Index [ms]sdann(float): SDANN [ms]rmssd(float): Root mean of squared NNI differences [ms]sdsd(float): Standard deviation of NNI differences [ms]nnXX(int, optional): Number of NN interval differences greater than the specified threshold (-)pnnXX(float, optional): Ratio between nnXX and total number of NN interval differences (-)nn50(int): Number of NN interval differences greater 50mspnn50(float): Ratio between NN50 and total number of NN intervals [ms]nn20(int): Number of NN interval differences greater 20mspnn20(float): Ratio between NN20 and total number of NN intervals [ms]nn_histogram(matplotlib figure object): Histogram plot figure (only if input parameterplotis Truetinn_n(float): N value of the TINN computation (left corner of the interpolated triangle at (N, 0))tinn_m(float): M value of the TINN computation (right corner of the interpolated triangle at (M, 0))tinn(float): TINN (baseline width of the interpolated triangle) [ms]tri_index(float): Triangular index [ms]
Important
The XX in the nnXX and the pnnXX keys are substituted by the specified threshold.
For instance, nnXX(nni, threshold=30) returns the custom nn30 and pnn30 parameters. Applying
threshold=35 as nnXX(nni, threshold=35) returns the custom nn35 and pnn35 parameters.
These parameters are only returned if a custom threshold (threshold) has been defined in the input parameters.
See also
Application Notes
It is not necessary to provide input data for signal, nni and rpeaks. The parameter(s) of this
function will be computed with any of the input data provided (signal, nni or rpeaks). The input data will be prioritized in the following order, in case multiple inputs are provided:
signal, 2.nni, 3.rpeaks.
nni or rpeaks data provided in seconds [s] will automatically be converted to nni data in milliseconds [ms].
See also
Section NN Format: nn_format() for more information.
Important
This function generates matplotlib plot figures which, depending on the backend you are using, can interrupt
your code from being executed whenever plot figures are shown. Switching the backend and turning on the
matplotlib interactive mode can solve this behavior.
In case it does not - or if switching the backend is not possible - close all the plot figures to proceed with the
execution of the rest your code after the plt.show().
Examples & Tutorials & Tutorials
The following example codes demonstrate how to use the time_domain() function.
You can choose either the ECG signal, the NNI series or the R-peaks as input data for the PSD estimation and parameter computation:
# Import packages
import biosppy
import pyhrv.time_domain as td
import pyhrv.tools as tools

# Load sample ECG signal
signal = np.loadtxt('./files/SampleECG.txt')[:, -1]

# Get R-peaks series using biosppy
t, filtered_signal, rpeaks = biosppy.signals.ecg.ecg(signal)[:3]

# Compute NNI series
nni = tools.nn_intervals(t[rpeaks])

# OPTION 1: Compute Time Domain parameters using the ECG signal
signal_results = td.time_domain(signal=filtered_signal)

# OPTION 2: Compute Time Domain parameters using the R-peak series
rpeaks_results = td.time_domain(rpeaks=t[rpeaks])

# OPTION 3: Compute Time Domain parameters using the NNI-series
nni_results = td.time_domain(nni=nni)
The output of of all three options above will be the same.
Note
If an ECG signal is provided, the signal will be filtered and the R-peaks will be extracted using the
biosppy.signals.ecg.ecg() function. Finally, the NNI series for the PSD estimation will be computed from the extracted
R-peak series.
See also
You can now access the parameters using the output parameter keys (works the same for the rpeaks_results and
nni_results):
# Print SDNN
print(signal_results['sdnn'])

# Print RMSSD
print(signal_results['rmssd'])